

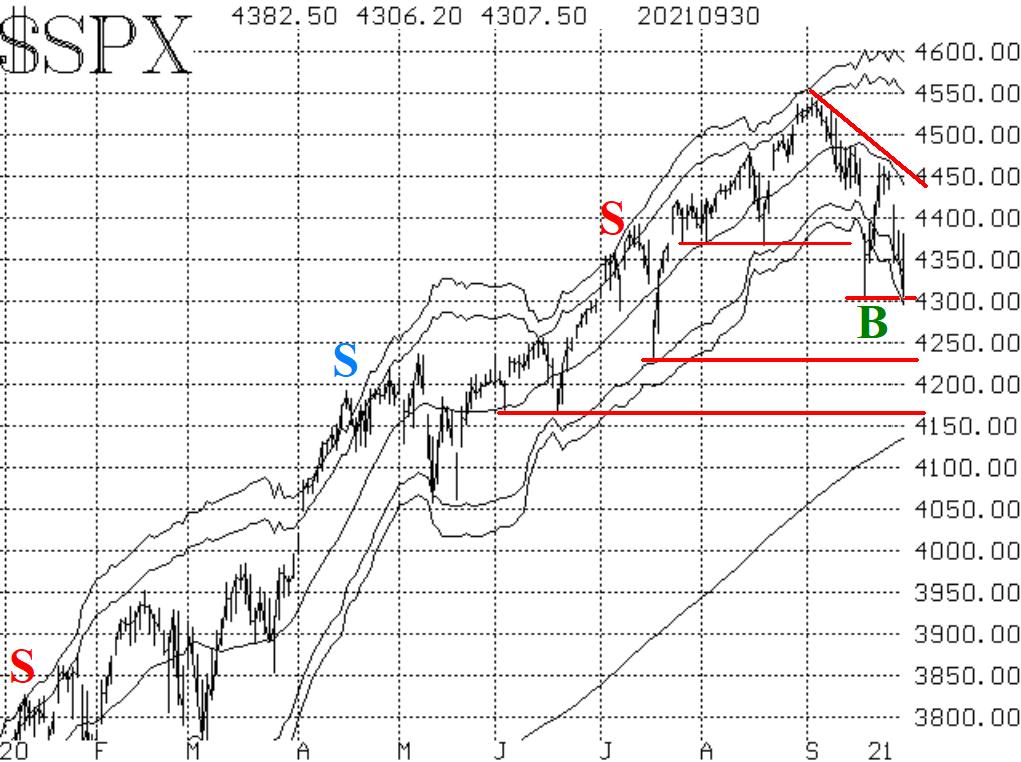
As is often the case, September turned out to be a bearish month, as the S&P 500 (SPX) made a new all-time high on the 2nd trading day of the month, but then reversed and traded down to the lows of the month on the last trading day, says Larry McMillan of Option Strategist.
This action has put the SPX chart in a downtrend, as there are now lower highs and lower lows (on a closing basis). A move below the mid-month low at 4305 would confirm this bearishness. We now enter October, which has a reputation as a "bear killer," but the first part of the month can be ugly before lows are reached later in the month.
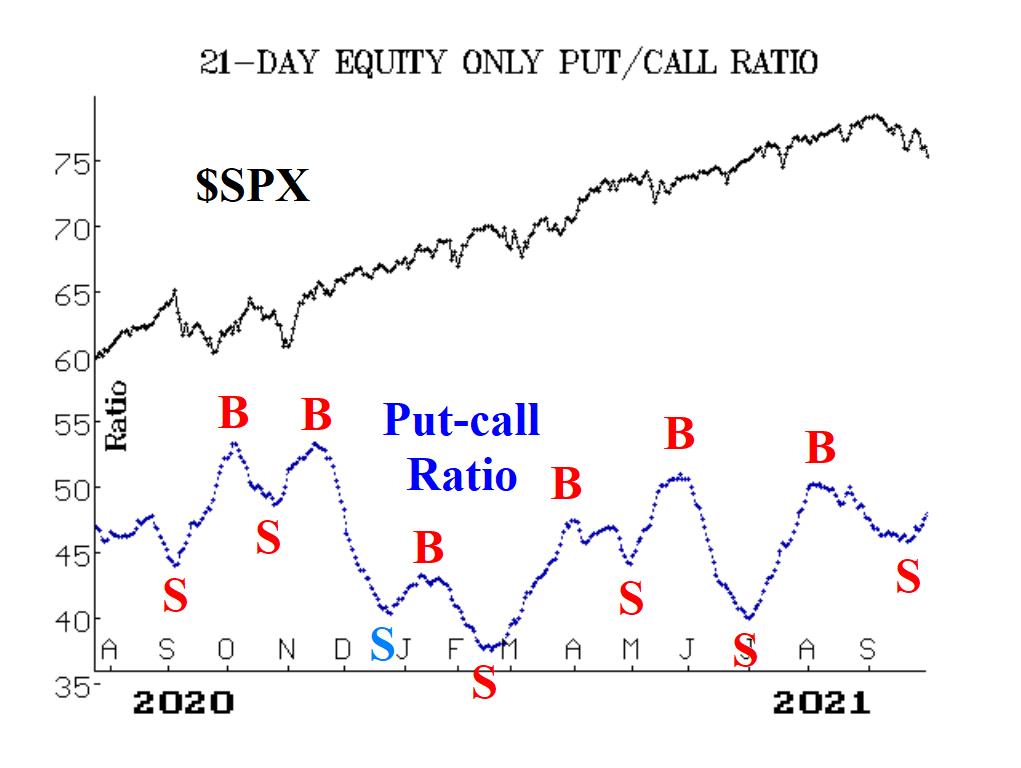
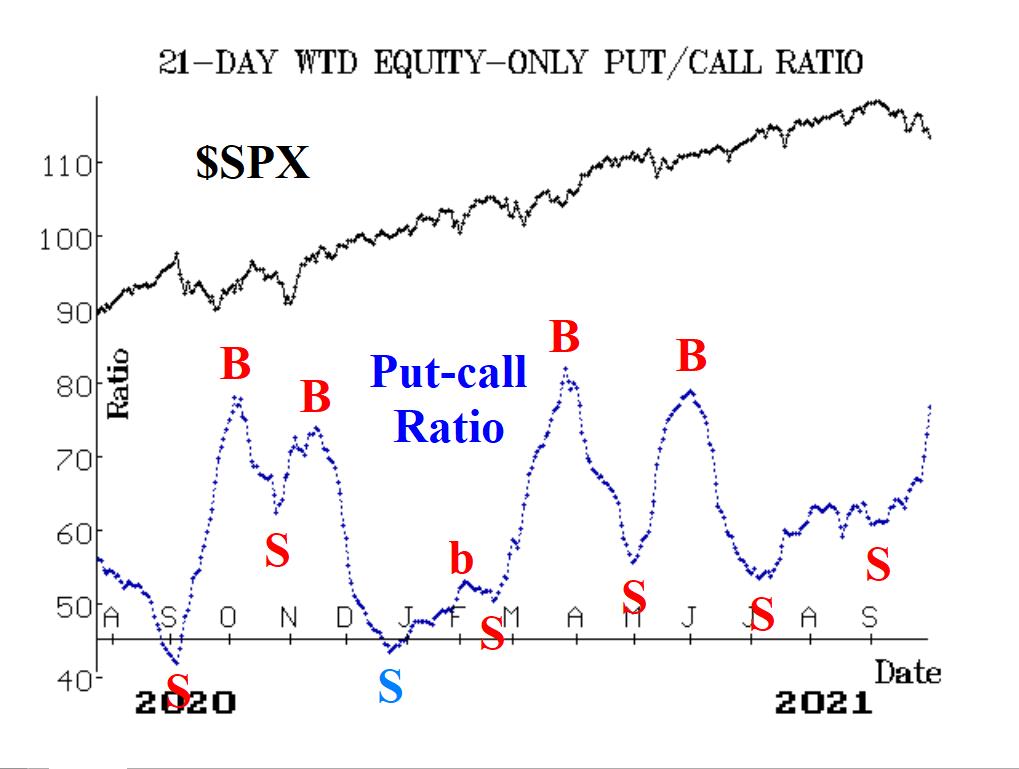
The equity-only put-call ratios are both on sell signals. The weighted ratio has been rising (i.e., on a sell signal) for quite some time, but the standard ratio only recently joined in. Now the weighted ratio is racing higher (Figure 3).
Breadth, which has been lagging nearly all year, is not as bad during this decline as one might have anticipated. As a result, both breadth oscillators are still clinging to buy signals.
Implied volatility in the form of CBOE SPX Volatility Index (VIX) and VIX derivatives has not really joined in the bearishness. First of all, a new VIX "spike peak" buy signal will set up soon.
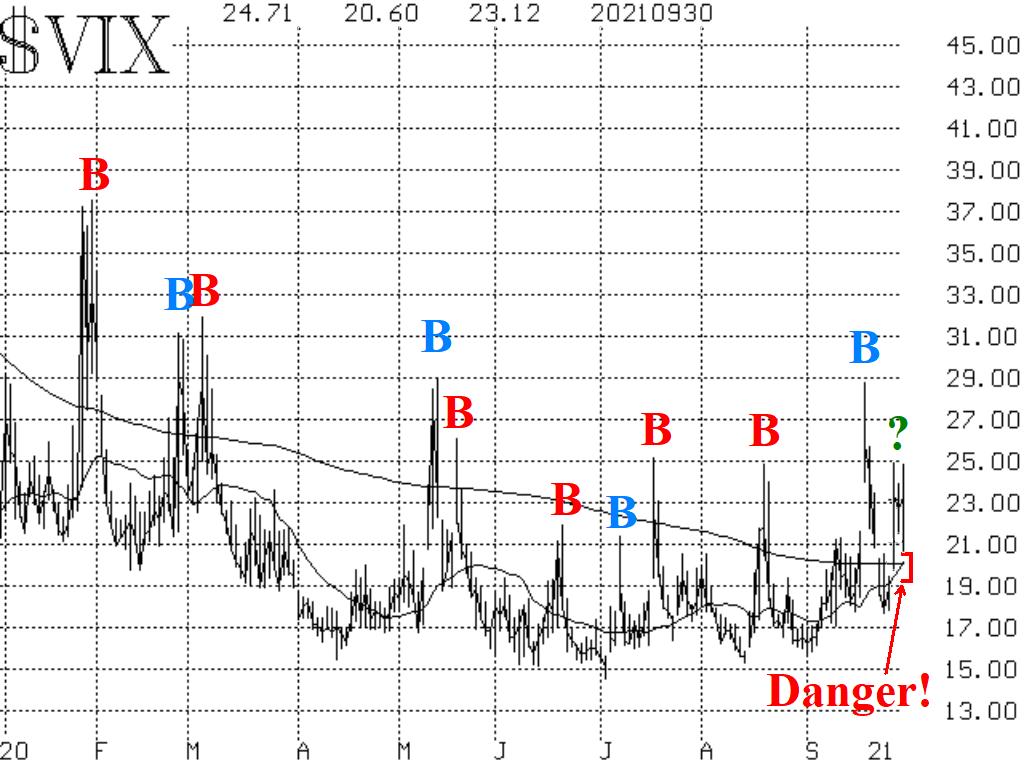
One area of implied volatility is giving a new, major sell signal: the 20-day moving average of VIX has crossed above the 200-day MA. That crossover is just by a few pennies, but it is a crossover for sure.
In summary, the picture has changed to a bearish one, at least for the short-term and maybe for longer. The chart of SPX is in a downtrend, and a close below 4305 would confirm a pattern of lower highs and lower lows.


