

There are many types of momentum equity strategies with varying effectiveness. The death cross is a well-known concept where you buy a product when its 50-day moving average crosses above the 200-day moving average and sell when the reverse occurs, states Joon Choi of Signalalert Asset Management.
This strategy keeps you invested during long-term uptrends but tends to generate delayed entries after large selloffs and delayed exits after large run-ups. The buy/sell signals do not occur very often, and they may reduce drawdowns during bear markets. In this article, I will present the effectiveness of death cross signals on the Dow Jones Transport Average.
Death Cross Strategy for the S&P 500 Index (SPX)
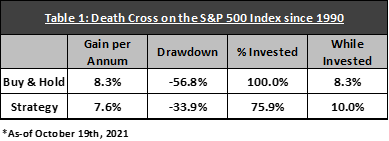
Whenever the S&P 500 Index’s 50-day moving average crosses its 200-day moving average, there are no shortage of articles mentioning the significance of the death cross (DC). This is because this strategy has been one of the simpler ways to reduce risk at the expense of a slight loss in return. For instance, trading the S&P 500 Index on DC since 1990 would have returned 7.6% annually with a maximum drawdown of 33.9% (not including fees and dividends). Meanwhile, SPX had an 8.3% annual return with a 56.8% drawdown, outperforming the DC strategy by 0.7% a year with a 22.9% additional drawdown (Table 1). However, DC was invested 75.9% of the time, which means the hypothetical portfolio would have gained 10% a year while invested when annualized (annual return of 7.6% divided by percent invested of 75.9%).
Not So Great for the Dow Transports
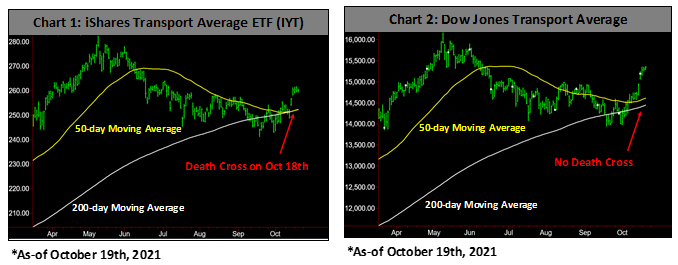
For the first time since the iShares US Transportation ETF (IYT) was launched in 2003, IYT had a death cross sell on October 18 (Chart 1) while the Dow Jones Transport Average did not (Chart 2).
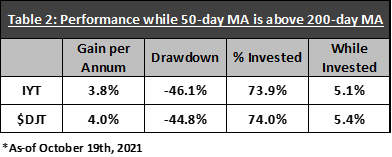
Trading IYT on its long-term moving average crossings significantly lowered the annual return (3.8% vs. 9.4% for buy & hold) while reducing 14.6% in drawdown (46.1% vs. 60.7%). Even when adjusted for the percent invested (73.9%), the annualized return of 5.1% trails the ETF return by a big margin. The strategy on the DJT yielded a similar result as IYT (Table 2), slightly better due to the absence of expenses for the index.
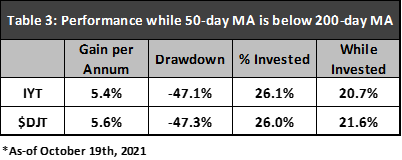
Surprisingly, IYT was more profitable (3.8% vs. 5.4%) with only a slight increase in drawdown (46.1% vs. 47.1%) when its 50-day moving average was below the 200-day MA (Table 3). Moreover, annualized returns shot up to 20.7% when the return was adjusted for the time invested (26.1%). This signifies a portfolio buying IYT only during death cross sells would have resulted in a 2.2 times higher rate of return than the buy & hold portfolio (20.7% divided by 9.4%).
Conclusion
Although a strategy to trade on the SPX death cross signals may seem plausible, using the same principle on the Dow Jones Transport Average is a terrible idea. Just ignore any news headline when someone writes about a death cross in the transport sector. My research seems to suggest that buying transport when the short moving average is below the long one may be a better idea. Let me emphasize that I am not recommending buying IYT at this time because there is no death cross in DJT and a drawdown of 47.1% is still substantial. However, if the DC occurs in DJT and the sector has some follow-through selloff (i.e., 5%+), then it will be tempting to add IYT. I will keep you updated on this topic in the future.
To learn more about Joon Choi, please visit Signalert Asset Management.


