

Over 92% of the companies in the S&P 500 Index (SPX) have reported third quarter earnings so far and 80.4% of them reported above analysts’ estimates, states Joon Choi of Signalalert Asset Management.
Although this figure is well above the long-term average of 65.8%, it’s a slight decrease from the prior four quarter average of 84.7%. Strong corporate earnings provided a tailwind for equities. However, there are some potential stock market headwinds to keep an eye out for in the coming months:
- Higher than expected inflation may translate into a surprise interest rate hike by the Fed.
- Biden’s administration may not keep Jerome Powell as Fed president, and could replace him with someone who is more willing to address the current lingering inflationary issue.
- Potential US debt default on December 15.
- Investors selling stocks to realize both gains and losses in anticipation of an income tax increase in 2022.
For the possibilities above, I believe equities will struggle to make new highs in the coming months. Thus, I am recommending in this article a market-neutral opportunity with a significant upside.
Emerging Markets
iShares launched the MSCI Emerging Markets ETF (EEM) (an emerging market ETF) in April 2003, and it has returned 10.6% per year, compared to 11.6% for S&P 500 ETF Trust (SPY). Underperforming the SPY by 1% is not a good relative performance, especially since EEM’s volatility was 50% greater than SPY’s during the period. Emerging market investors were not rewarded for taking on additional volatility. Even worse, EEM has returned just 1.5% per year since November 2007, while SPY has averaged 10.4%.
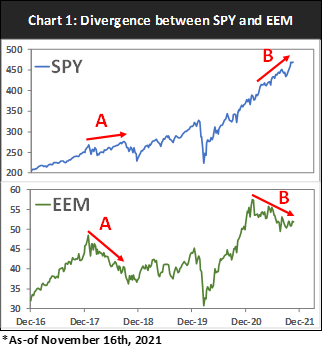
As we are approaching year end, SPY and EEM are diverging against one another, very similar to the period leading up to October 2018 (Chart 1). Notice that SPY made new highs from February to September (Point A), but EEM continued to make new lows (Point B). SPY eventually experienced a 19%+ selloff in the fourth quarter, whereas EEM had a reduced selloff of 10%; probably because it had already been under pressure. While EEM has been trending down since mid-April, SPY has continued to make new highs (Point B). This divergence is at seven months, whereas it was eight months before the double-digit selloff.
FXI vs. EEM
A year after launching EEM, iShares met investors’ overwhelming appetite to invest in China by launching iShares China Large-Cap ETF (FXI). After appreciating 320% in the first three years, it has been losing 1.7% a year; SPY gained 10.4% in comparison.
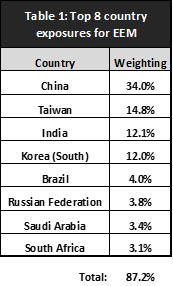
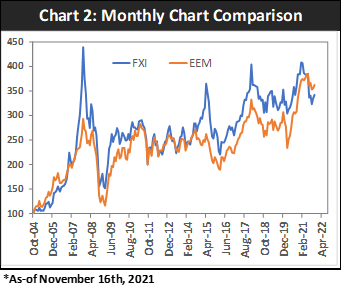
Chinese stocks have the greatest exposure (34%) of all countries in EEM (Table 1), with 87.2% of EEM holdings from eight countries. So, it is no surprise that FXI and EEM have had a very high correlation of 87% since 2014; compared to 80% between SPY and EEM. (Chart 2 shows how similar monthly price movements have been in FXI and EEM since 2004.) However, relative strength between FXI and EEM has been oscillating since its launch.
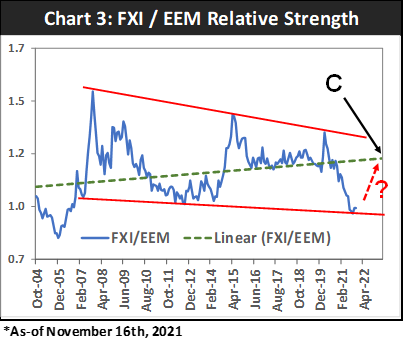
I divided the weekly FXI prices (dividend adjusted) by EEM to form a relative strength ratio (Chart 3). FXI has been sharply underperforming EEM since April 2020, and bounced off the lower trading line in recent months. A wedge formation can be seen as the upper resistance line is slightly more down-sloping than its lower counterpart. Note how much the relative strength (RelStr) stretched away from the linear trendline in green (i.e., best fit line). Historically, sharp penetrations above trendlines were met with equally sharp mean reversions to the trendline (i.e., 2008, 2015, and 2020). So, I consider the FXI/EEM ratio will likely see a sharp reversion back to the trendline as well (C in Chart 3) with a profit target of 17%.
Conclusion
2021 took Wall Street by surprise as the consensus call for US stocks were in high single digits at the beginning of the year, and yet the S&P 500 Index is up 25% as of this writing. However, EEM diverging vs SPY since mid-April may be a prelude to a double-digit selloff similar to the one in 2018. In addition, chinese stocks have been under pressure against their counterparts in EEM, but I trust FXI will see a sharp bounce back vs EEM in the coming months. As a result, I have a few recommendations:
- Buy FXI and short EEM in equal dollar amounts. You can easily borrow EEM shares to short without any fee at TD Ameritrade and Schwab. Profit target is 17%.
- If you are looking to add equity exposure, consider waiting till year end. Also, consider adding EEM; this is the first time that I am recommending EEM over SPY since I have been writing for the past six years.
- Although Wall Street’s general consensus of increasing emerging market exposure coming into 2021 has not panned out as of this writing, I would recommend replacing some SPY exposure with EEM heading into 2022—we may finally see emerging markets outperform the US stock market next year, whether it be to the upside or downside.
To learn more about Joon Choi, please visit Signalert Asset Management.


