

The big butterfly is a “flappin’” its wings, and the stock market is a “crashin’.” But is it time to panic, asks Joe Duarte of In the Money Options?
Aside from the fact that panicking and trading are never a good combination, which is why we design trading plans, last Friday’s global stock plunge may turn out to be just another in a line of overreactions from algo traders.
You know the drill. Headlines hit. CTA algos react to their programs. Order flows skew in a certain direction. Options markets react. Market maker algos hedge. Big scary move in the stock market develops. Rinse, repeat.
Of course, a bear market could start at any time. And whether it’s algos or people who do the selling, anytime the market falls and you own stocks, the odds of losing money rise.
Still, disciplined traders who use sell stops and have taken some profits recently, as I’ve suggested, have been considering the possibility of such a scenario and have thus acted accordingly.
Certainly, anyone who read last week’s headline in this space: “What if the Covid Lockdowns Surge Just as the Fed Starts to Taper?” and the subsequent discussion (weakening market breadth, the Fed tapering) should have been warned about the possibility of a new Covid scare and the potential for a meaningful pullback in stocks.
The “Nu” Virus
So, there is a new virus in town—the so called “Nu” variant of the Covid-19 stable, also known as “Omicron.” And yes, there are emerging lockdowns and travel restrictions being deployed or considered all over the world.
In addition, since “Nu” is a pure incarnation of Chaos, as were all its predecessors, the financial markets–the algos–responded in a predictable manner: by selling everything as the recovery trade gives way to the lockdown trade.
Of course, no one knows where this is going. And it goes without saying that from a health and population effect standpoint, this new variant should be taken seriously, which means that all plausible safety measures for self-protection should be instituted by everyone, everywhere, as best as possible.
Still, from a market standpoint, it brings me back to the question that I asked last week: “Does it make sense for the Fed to taper as a “fourth wave of Covid” begins to develop?”
The answer is clearly no. But then, since I’m not in charge of the Fed, we’ll just have to wait and see what happens.
So, Who Wins This Round?
There are winners and losers in every situation, including periods of market turmoil. And in the markets the key to who ends up in the winner’s circle and the loser’s bin is all about the direction of market liquidity and interest rates.
The news two weeks ago was all about how the Fed was going to increase its rate of tapering its QE and how the big banks were jumping over one another to predict a more aggressive rate hike increase than what the central banks were owning up to.
But suddenly, things have changed. A new virus panic is developing, and we all know what the Fed did in response to the last virus panic—they put the digital the printing presses into maximum overdrive. Of course, the net effect was to create the conditions for a huge stock market rally.
So, the question is whether they will do the same thing again, and which sectors will benefit?
And the best clues may come from the bond market. That’s because as the bond market goes, the Fed is likely to follow; albeit sometimes kicking and screaming. And the initial reaction in the US Ten Year Note yield (TNX) was positive as yields broke below key support.
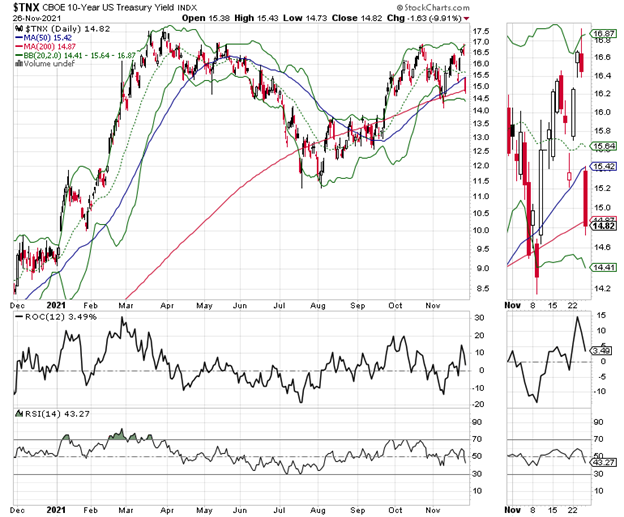
Specifically, the key chart point is the 1.45% yield area, which is just below the 200-day moving average for TNX. A decisive move below this point would likely trigger money flows to key interest rate sensitive stock market sectors such as Housing (XHB) and REITS (IYR), although this may not be immediate.
Sure, it’s a bit early to tell which way things will go. But if bond yields continue to move lower, those two sectors will eventually see some positive developments.
Still, for now, it’s best to be safe and let the market tell us what’s next by adhering to these general rules:
- If you get stopped out of a position, stay in cash.
- Be prepared to move back into the market once the dust settles.
- If you are not stopped out of a position, that means it’s got relative strength, so stick with it until you get stopped out.
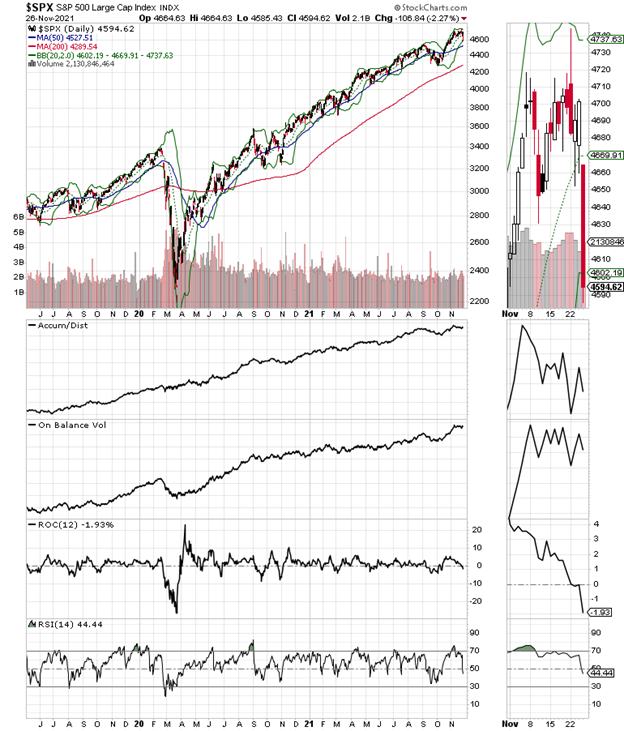
Bullish Tone in Options Market Faded at 4700 on S&P 500 (SPX)
Options traders turned bearish at 4700 on SPX and near the 470 area on S&P 500 ETF Trust ETF (SPY), as evidenced by rising put option activity and the subsequent hedging. As a result, stocks rolled over on Friday’s option expiration.
The real question is what the market will do during the holiday shortened week with thin volumes and the potential for bad news on Covid.
How does the options market affect stocks? Here are the simple steps again:
Implied Volatility Suggests More Bumps May Lie Ahead
Last week, I noted that options traders turned bearish at 4700 on SPX and near the 470 area on SPY, as evidenced by rising put option activity and the subsequent hedging. As a result, stocks rolled over on Friday’s option expiration.
Flash forward and we saw that by midweek, Implied Volatility (IV) for SPY options was moving higher, suggesting that a big move was coming. Moreover, with the Volatility Index (VIX) breaking well above its recent highs, we now have the possibility that volatility will increase even further as IV moved even higher.
That said, with IV topping out near 20 for SPY, if we see a move lower in VIX here, it could mean that a bounce is likely.
So here is a quick review on how the options market affect stocks:
- Call buyers force market makers to sell calls.
- Market makers hedge their call sales by buying stocks and stock index futures.
- The cycle self-reinforces as long as call buyers persist, and the stock market moves higher.
The opposite is true when put buyers are in charge as they were last week. The bottom line is that the stock market’s trend is highly influenced by the sentiment and the action in the options market.
In other words, a preponderance of bullish option traders (call buyers) usually means rising stocks and high numbers of bearish option traders (put buyers), usually leading to lower stock prices.
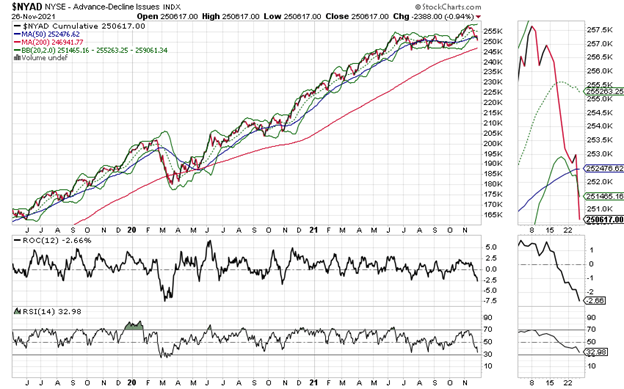
Divergence Correctly Predicted Market Decline. What’s Next?
The New York Stock Exchange Advance Decline line (NYAD) rolled over two weeks ago and followed through on 11/26/21 with a break below its 50-day moving average. This coupled with the prior break of the RSI below 50 means we are now in sell signal territory.
On the other hand, the RSI is near 30 and NYAD is trading below its lower Bollinger Band, which means that it is oversold and that some sort of bounce is on its way. As a result, it is plausible that we may be closer to the end of the correction than the majority may think, although markets can stay oversold for very long periods of time.
The SPX rolled over and fell below its 20-day moving average, but remains well above its 50-day line. Meanwhile, Accumulation Distribution (ADI) fell, but On Balance Volume (OBV) remained near its recent highs. This suggests that short sellers are moving in but that, for now, the long side is holding off on aggressive selling.
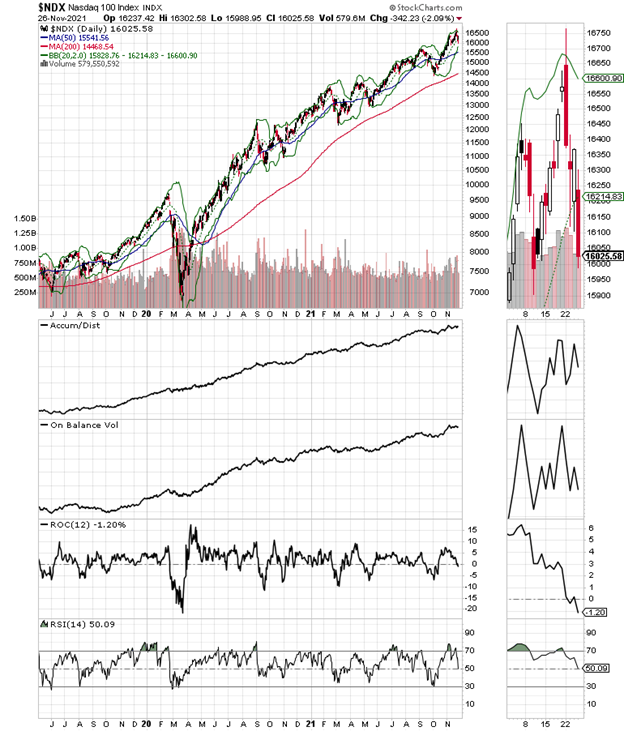
The Nasdaq 100 Index (NDX) also confirmed the recent high on NYAD. Even better, the NDX breadth line made a new high, with Accumulation Distribution (ADI) and On Balance Volume (OBV) confirming.
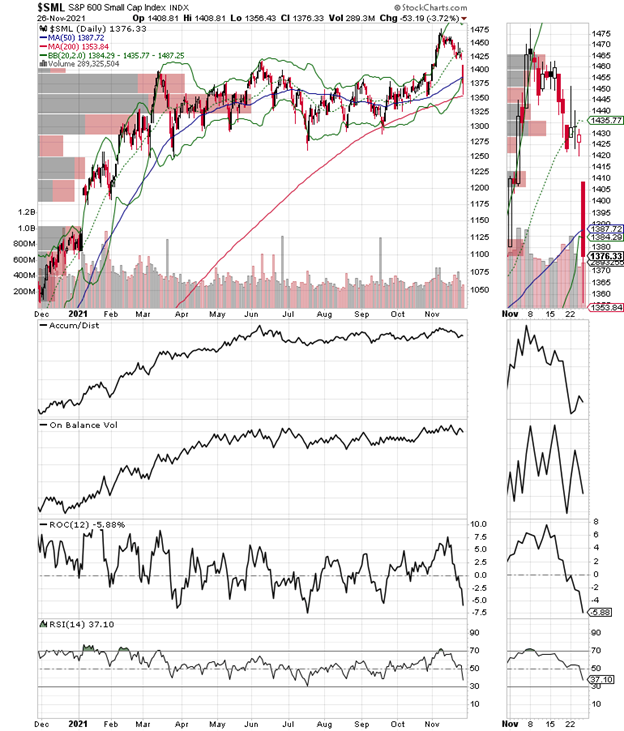
Small stocks took the brunt of the selling the S&P Small Cap 600 Index (SML) closed below its 50-day moving average.
To learn more about Joe Duarte, please visit JoeDuarteintheMoneyOptions.com.


