

The holiday-shortened week ended with a broad sell-off in the major averages, states Bonnie Gortler of bonniegortler.com.
Ten of the eleven sectors fell, with five weaker than the SPDR S&P 500 ETF Trust (SPY), down -1.79%. Energy (XLE) and Consumer Staples (XLP) were the strongest sectors, while Consumer Services Sector (XLC) and Consumer Discretionary (XLY) were the weakest.
S&P SPDR Sector ETFs Performance Summary 11/19/21 - 11/26/21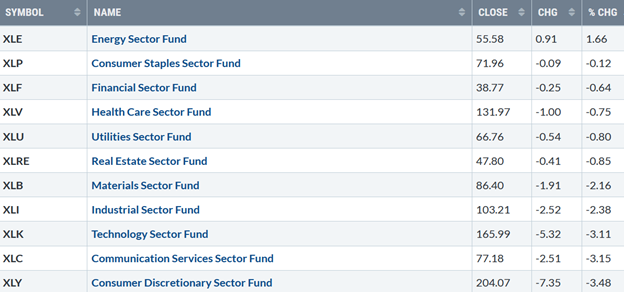
Source: Stockcharts.com
Figure 2: ETFs Bonnie's Watching Closely Performance Summary 11/19/21 – 11/26/21 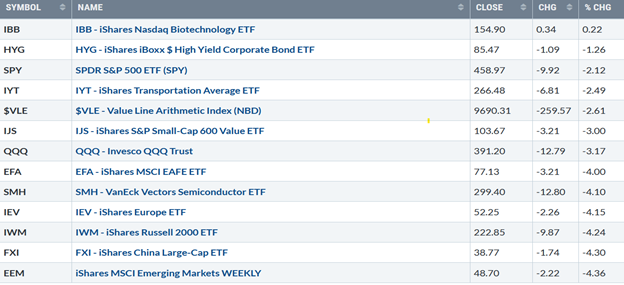
Source: Stockcharts.com
Biotechnology was the only winner for the week. Global markets were the weakest. China (FXI), which had looked like a potential buy opportunity, fizzled. (Figure: 14 ).
All major averages finished the week lower, falling sharply on Friday when the report of a new coronavirus variant was discovered in South Africa. The Dow fell -1.97%, its third losing week in a row. The S&P 500 was down -2.20%, and the Nasdaq was down -3.52%. The Russell 2000 Index fell -4.15%.
Weekly market breadth deteriorated on both the NYSE and Nasdaq. The New York Stock Exchange Index had 815 advances and 2714 declines. Nasdaq had 1177 advances and 3793 declines.
Figure 3: 10-Year US Treasury Yields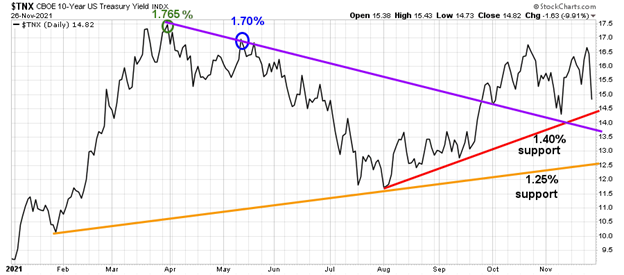
Source: Stockcharts.com
10-Year US Treasury yields fell, closing at 1.482, up from 1.536% the previous week but below April’s highs (Figure 1). Support remains between 1.25% and 1.40%. Resistance is between 1.65% and 1.80%. A close above or below resistance is likely to cause additional volatility in the equity and bond market.
Figure 4: Daily New York Stock Exchange (NYSE) New Lows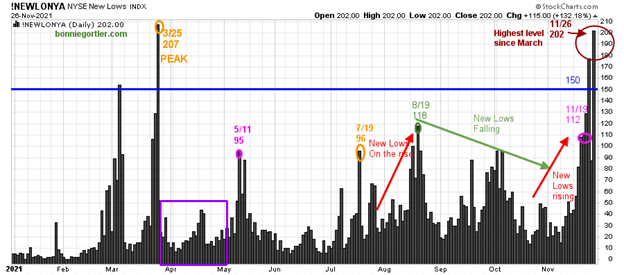
Source: Stockcharts.com
New lows on the NYSE peaked at 207 (orange circle) on 3/25/21. New lows then contracted (purple rectangle) before rising to 95 on 5/11, 96 on 7/19, and another peak of 118 on 8/19 (green circle).
Watching new lows on the New York Stock Exchange is a simple technical tool that helps awareness about the immediate trend's direction.
Learn more in my book, Journey to Wealth. Here is an excerpt, "If the new lows are above 50, it is an alert or warning of possible market weakness or a change in market tone. Be aware, it’s a good idea to make sure you are happy and comfortable with your portfolio. It is best not to have more volatile investments than you can handle where you feel uncomfortable. If the selling continues, you could have some serious losses occurring if the market falls further. When new lows are above 150, the market is negative, higher risk, and selling is taking place. Sometimes it could be severe, and sometimes on a very nasty day, you can have 'panic selling,' and big wild swings (high volatility) to the downside may occur."
New lows are negative, closing at 202 (brown circle), above 150 (blue line), now in the high-risk zone. Expect higher volatility and a bumpy road ahead until they contract and get below 50.
Figure 5: The Value Line Arithmetic Average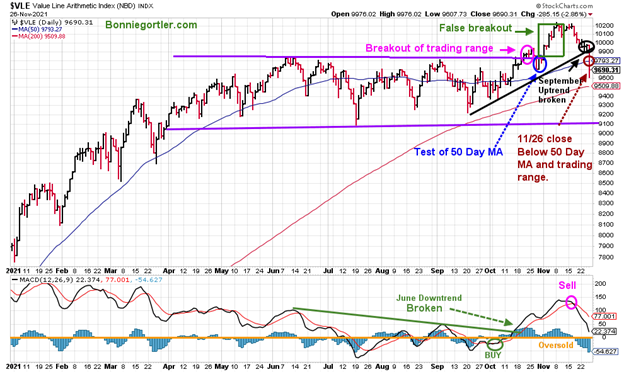
Source: Stockcharts.com
The Value Line Arithmetic Average (VLE) is a mix of approximately 1700 stocks. VLE broke out of its trading range (pink circle) after a successful test of the 50-day moving average at the end of October.
VLE fell sharply -2.61% again last week after falling 2.31% the previous week, not what occurs typically after a breakout of a 7-month trading range (purple line). The trend has now shifted to down after breaking the September uptrend (black line). Until VLE closes above 10,000, the risk of a more serious decline exists.
MACD (lower chart), a momentum indicator, is falling and on a sell. The odds favored another rally will occur since MACD confirmed the high made in the VLE. However, MACD is not yet oversold, below 0, and has no signs of slowing downside momentum. More time is needed for a favorable pattern to develop.
Figure 6: Daily Nasdaq Advance-Decline Line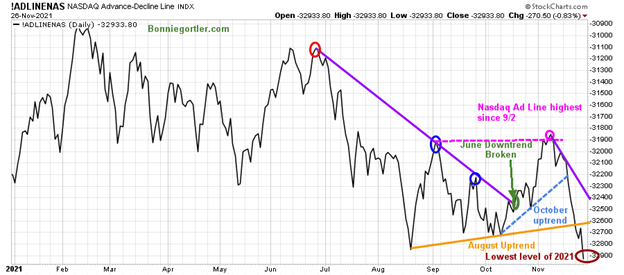
Source: Stockcharts.com
The daily Nasdaq AD-Line failed to get through the June downtrend (purple line) and turned down in September, making lower highs. The Nasdaq AD-Line made a higher low in October, holding above the August lows (orange arrow), and turned up. The first week of November, the AD-Line rose sharply to its highest level since 9/2, not getting through resistance, and then turned down.
The AD-Line gave advanced warning a decline was forthcoming after breaking the October uptrend (blue dotted line). The moment of truth came and is gone.
The August uptrend was broken and now at a new low, its lowest level of the year (brown circle). More time is needed for a favorable buying pattern to develop.
Figure 7: Transportation Average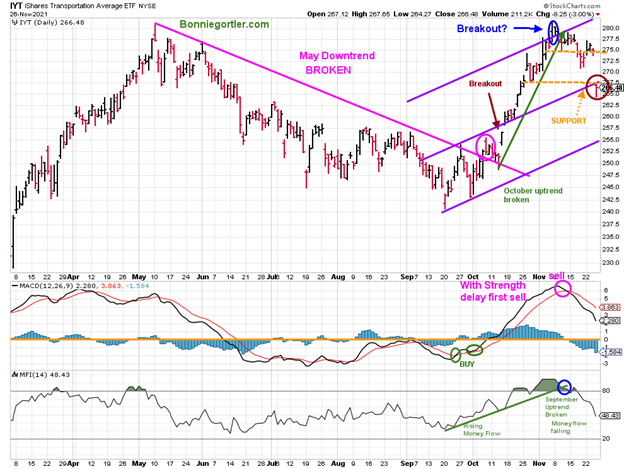
Source: Stockcharts.com
The Transports (IYT) rose in October, but came under some selling pressure in November after meeting its first upside objective.
IYT closed at 266.48, down -2.49%, slightly under support at 267.50, back-to-back weeks after breaking the October uptrend. The following support is at 255.00.
Resistance is 267.50, followed by 275.00, and 280.00, with an upside objective to 287.50.
MACD (middle chart) remains on a sell. However, since MACD confirmed the high made in IYT, I’m expecting another rally is likely before a significant correction. So far, IYT is weaker than I expected, but not surprising since Money Flow (lower chart) has not turned up and continued lower. Continue to watch the money flow if it weakens or starts rising again
Figure 8: Daily iShares Russell 2000 (IWM) Price (Top) and 12-26-9 MACD (Middle and Money Flow (Bottom)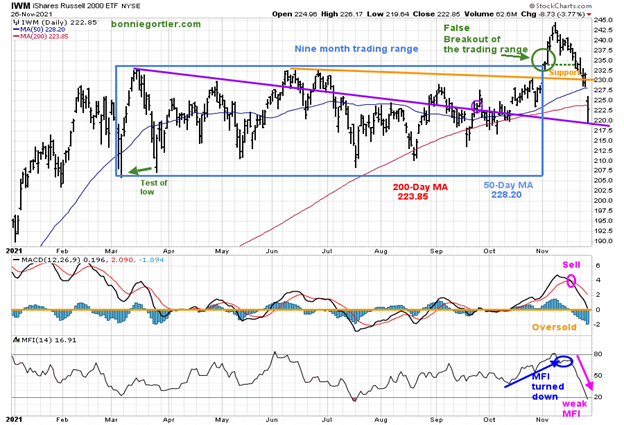
Source: Stockcharts.com
The top portion of the chart is the daily iShares Russell 2000 Index ETF (IWM), the benchmark for small-cap stocks, with a 50-day moving average (MA) (blue line) and 200-day moving average (MA), that traders watch and use to define trends.
A false breakout occurred in IWM after being in a nine-month trading range. For the third week in a row, IWM fell, down -3.77%, at 222.85, closing below its 50-day and 200-day moving average.
Support is 219.00.00 followed by 205.00. Resistance is at 225.00, 230.00, and 235.00
MACD (middle chart) is on a sell. The last thrust of MACD making a higher high confirmed the high in IWM. Therefore, it remains a rally toward the highs will occur. However, there is no favorable bottom formation with MACD falling and not yet oversold. Therefore, a safer buying opportunity is likely over the next 3-6 weeks.
Money Flow (lower chart) is weak and is falling. Watch MFI for a turn-up and bottoming formation to develop.
Figure 9: Daily Relative Strength Ratio Russell 2000 (IWM)/S&P 500 (SPY) 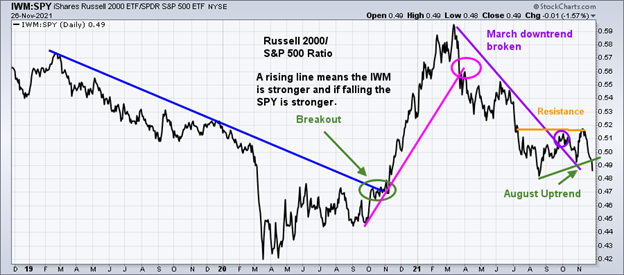
Source: Stockcharts.com
A rising line means the IWM is stronger, and if falling, the SPY is stronger. IWM has turned up and is now leading in relative strength.
IWM did not outperform the S&P 500 (SPY), failing to get through resistance, but it broke the August uptrend. The IWM/SPY ratio on the weekly chart also failed, breaking the uptrend from April (chart not shown).
The odds no longer favor IWM will outperform the S&P 500 in the near term and it is now considered high risk.
Figure 10: Daily Invesco QQQ Trust Nasdaq (QQQ) Price (Top) Money Flow (Middle) and 12-26-9 MACD (Bottom)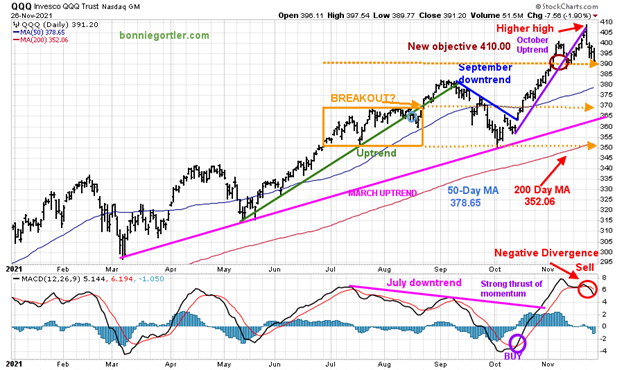
Source: Stockcharts.com
The chart shows the Daily Invesco QQQ (QQQ), an exchange-traded fund based on the Nasdaq 100 Index with its 50-day moving average and 200-day moving average. In June, QQQ was in a trading range (orange rectangle) and then broke out above 370.00 in August, which failed. A decline followed to 350.00 support in late September.
After breaking the short-term downtrend from 10/7 (blue line), QQQ continued to climb in November. The March uptrend (top chart) remains intact (pink line) and would be broken with a close below 365.00.
Last week, QQQ came close to its upside target of 410.00 on Monday, with a high of 408.71 before reversing lower as we alerted you in the Market update 11/19/21. QQQ closed at 391.20, down -3.17%, hitting the first support of 390.00 on Friday.
After making a new 52-week high the previous week, Apple, its largest holding, also reversed closing at a critical short-term support area (See Figure 11). Any weakness in AAPL would put downside pressure on QQQ.
Support remains at 390.00, followed by 380.00 and 370.00. The lower chart is MACD (12, 26, 9), a measure of momentum. MACD gave a timely buy signal and is now on a sell.
MACD made a new high, strong thrust of momentum after breaking the July downtrend. Last week, in the Market Update 11/19/21, I alerted you that the first MACD sell is likely not to be a serious correction. “A period of consolidation may be necessary. The second sell, when and if it occurs, should be followed. With the rise in QQQ, MACD moved sideways and did not give a sell. However, a potential negative divergence has formed where QQQ made a higher high and MACD a lower high. Therefore, if MACD does not make a higher high, take the next MACD sell when given."
A MACD sell did occur, and it will take time before MACD is in an oversold condition. Therefore, be patient and wait for a safer entry. The short-term action in Apple (AAPL) will be a clue if QQQ will reverse higher.
Figure 11: AAPL 60 Minute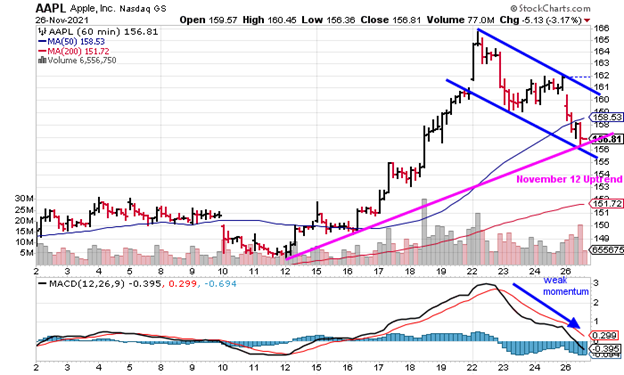
Source: Stockcharts.com
Apple remains in an hourly uptrend despite the 3.17% decline on Friday. A turn up above 159.00 would be positive in the near term. A close below 155.00 would be negative. Short-term support 150.00 followed by 144.00. Resistance is at 159.00, followed by 162.00, and 166.00.
Don’t hurry to buy until MACD momentum stops declining and, at minimum, begins to flatten.
Figure 12: Van Eck Semiconductors (SMH) Daily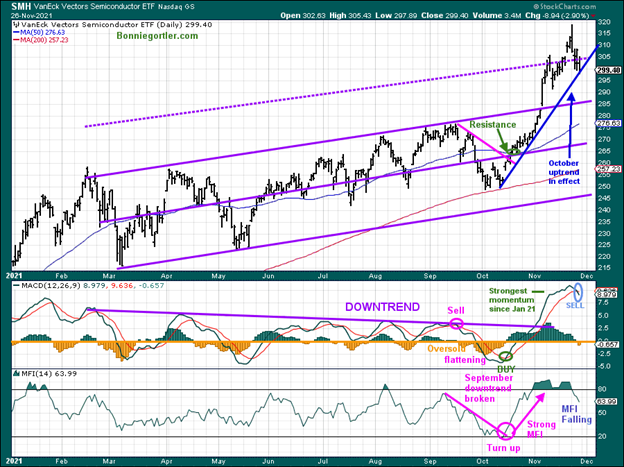
Source: Stockcharts.com
Semiconductors (SMH) had a great run, with the October uptrend (blue line) intact leading the technology sector higher. Even Semiconductors fell last week down -4.10%, closing at 299.40, just missing the next upside objective of 322.00, with a high of 318.82 on 11/22/21 before declining.
Support is 296.00 followed by 285.00. MACD (middle chart) is on a sell after very strong momentum. Look for MACD to decline over the next week or two and not likely to reset, and go below zero.
Money flow (lower chart) is falling; a sign of another run-up in SMH is if Money Flow turns up. It will be favorable if Semiconductors move higher and are stronger than the Nasdaq (IXIC) and S&P 500.
Figure 13: ARKK Innovation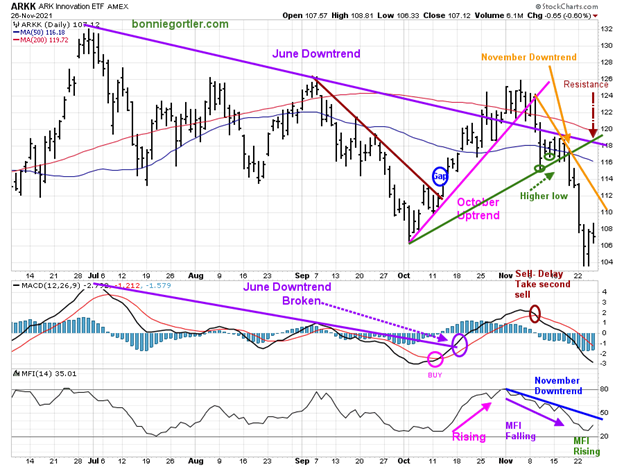
Source: Stockcharts.com
ARK Innovation ETF (ARKK), an actively managed ETF by Cathie Wood that seeks long-term growth.
ARKK broke its September short-term downtrend (brown line), gapped up, and then rallied, but it was short-lived. ARKK broke below the October uptrend (pink line), fell below the gap (blue circle), and trended lower even after higher lows developed (green circles).
Last week the downtrend continued. Stocks in ARKK fell sharply -5.40%. The positive is ARKK only fell -0.60% on Friday. It’s worth watching the action in ARKK if it turns up and is stronger than the Nasdaq, which would be bullish for the short term.
However, if it turns down and lags, this would imply further weakness ahead.
MACD is on a sell, oversold, below zero but still falling.
The money flow (lower chart) trend is down but turned up. When MFI breaks the November downtrend, this will imply another leg up is possible. The bears are now in control until the downtrend is broken.
Resistance is at 112.00 followed by 118.00. Support is at 104.00 followed by 98.00.
Potential Buying Opportunity in China Cancelled
Figure 14: Daily iShares China Large-Cap ETF FXI (Top)
iShares China Large-Cap Relative Strength Ratio (FXI)/S&P500 (SPY) Bottom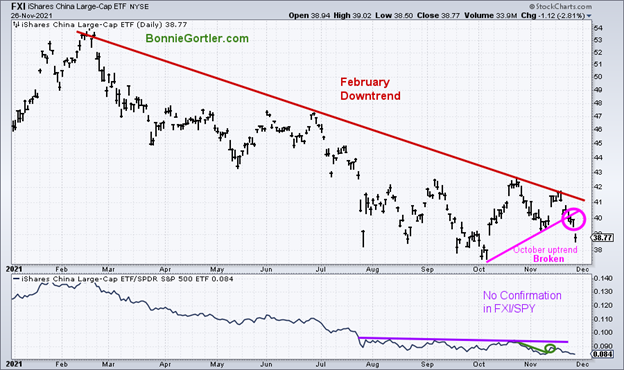
Source: Stockcharts.com
In the 11/19/21 update, I mentioned a potential buying opportunity in China remained possible. However, with the uptrend violated last week, more time is needed.
More Concerning Developments to Monitor
Figure 15: New York Stock Exchange AD-Line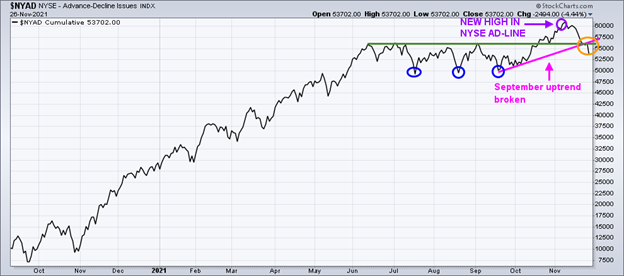
Source: Stockcharts.com
In the top portion of the chart (Figure: 15), The NYSE A/D line made a new high on 11/8/21, but since then, it has fallen, and is negative, so the September uptrend is no longer in effect.
As a result, it will take time for a favorable pattern to develop. In the meantime, the lows made in July, August, and September are essential to hold (blue circle) over the next several weeks.
Figure 16: I Shares Hi Yield Corporate (HYG)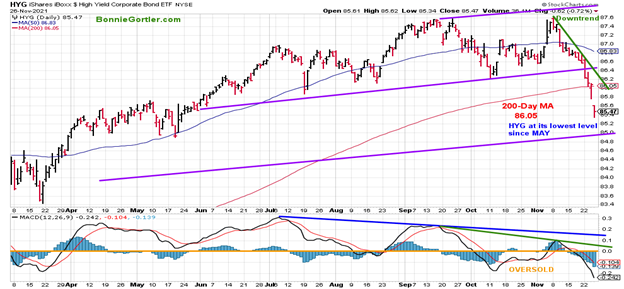
Source: Stockcharts.com
Hi-Yield Bonds (HYG) has been in a clear downtrend (green line) since the peak on 11/8/21 and closed below its 200-day moving average, now at its lowest level since May, with support at 85.00 and resistance at 86.60 (*monthly dividend 11/30).
Figure 17 Lord Abbett High Yield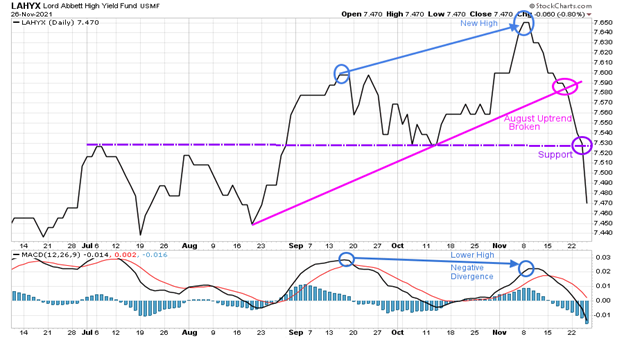
Source: Stockcharts.com
Lord Abbett High Yield, an open-end mutual fund, broke its August uptrend, closed below support, and its lowest since August. Monitor the action in Hi Yield bonds this week as a clue if US equities will stabilize.
Figure 18: CBOE Volatility Index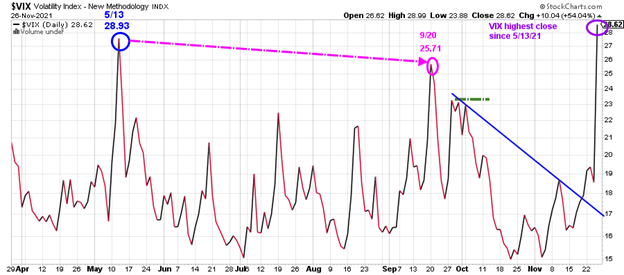
Source: Stockcharts.com
The CBOE Volatility Index (VIX), a measure of fear, rose sharply, up 54.05% on Friday, the highest close since 5/13/21 and one of the biggest one-day gains in history.
A sign that the major averages will stabilize is if $VIX begins to fall. On the other hand, an increase in $VIX implies the latest decline will continue.
Summing Up:
Tape action shifted to negative, with all major averages finishing the week lower. The short-term trend is down on rising volatility, which increases risk. Market breadth deteriorated with new lows rising on the New York Stock Exchange and Nasdaq. As a result, many short-term uptrends and support levels were violated, and momentum oscillators weakened and are now pointing down. More time is needed to signal that the recent decline will not accelerate. Be patient and wait for a confirmation of favorable bottom formations to develop.
Remember to manage your risk, and your wealth will grow.
I would love to hear from you. If you have any questions or comments or would like to talk about the market, email me at Bonnie@Bonniegortler.com.
Disclaimer: Although the information is made with a sincere effort for accuracy, it is not guaranteed that the information provided is a statement of fact. Nor can we guarantee the results of following any of the recommendations made herein. Readers are encouraged to meet with their own advisors to consider the suitability of investments for their own particular situations and for determination of their own risk levels. Past performance does not guarantee any future results.


