

One of the advantages of writing a newsletter is that it creates a space to review the markets from a longer-term monthly perspective rather than the normal hectic daily cycles, states Ian Murphy of MurphyTrading.com.
As global equity markets tanked on Friday in response to the emergence of the Omicron variant in South Africa, I had a look at the Tidal Strategy chart. This month’s candle will finish today, and next month’s candle will have to travel a long way down the chart to close out the current position. The conservative approach to this strategy entered 15 months ago at $349.31 (blue arrow), while the active approach entered two months earlier in June 2020.
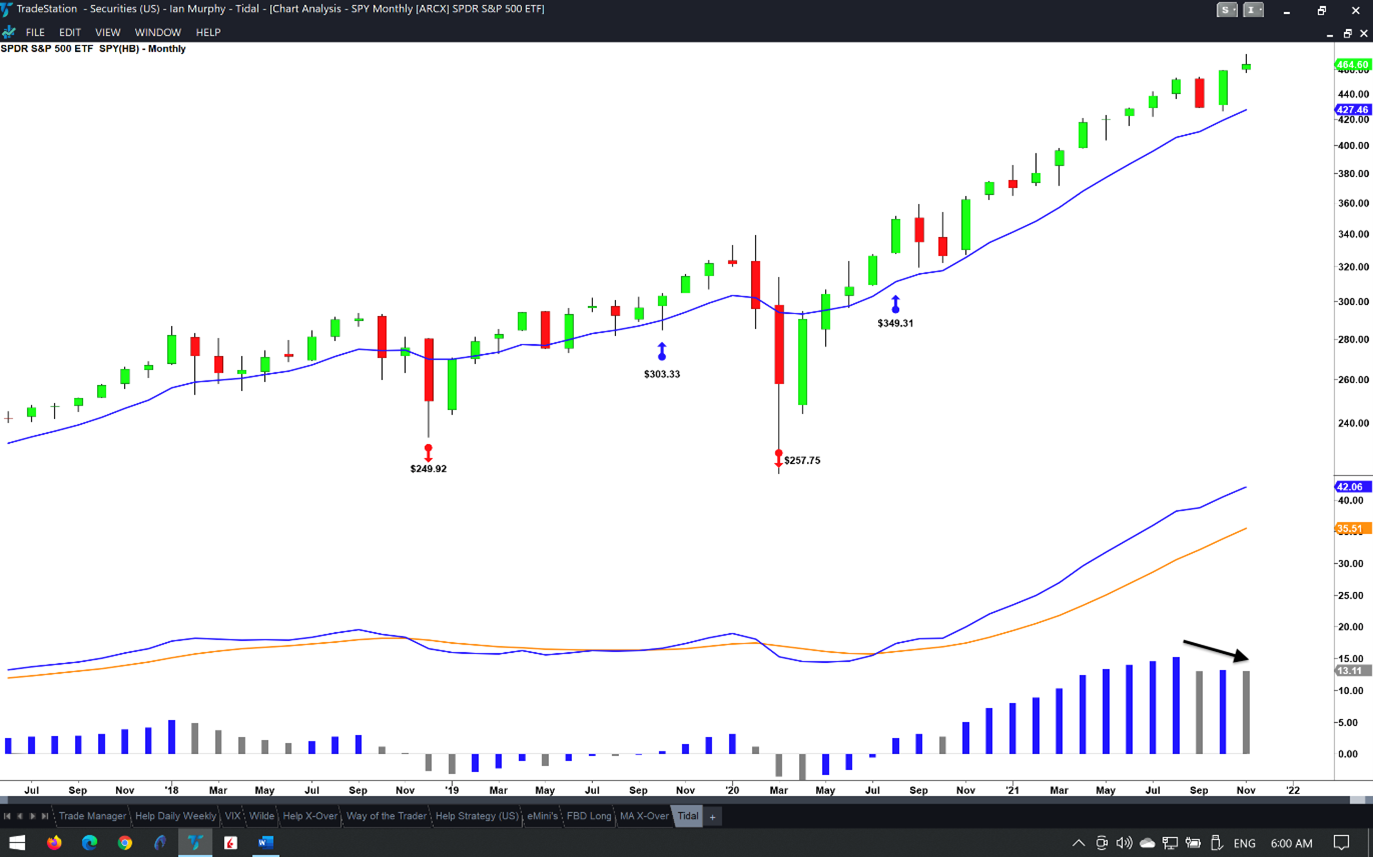
To exit current positions, conservative traders will look for the MACD-H to close below zero, and it has started moving in that direction (black arrow). Active traders will exit when the S&P 500 ETF Trust ETF (SPY) closes below the 10EMAC (blue line).
Composite Help Does It Again
As traders and investors, we are constantly trying to get ahead of a market move so we can leverage the realized volatility that follows. Over the years I’ve tried any number of indicators to gain this elusive insight, and an analysis of all stocks in a market which are making new highs and new lows remains the best leading market indicator.
By merging three time frames (monthly, quarterly and yearly) into one indicator, Composite Help consistently flags a move in the market before it appears on equity indices such as the S&P 500.
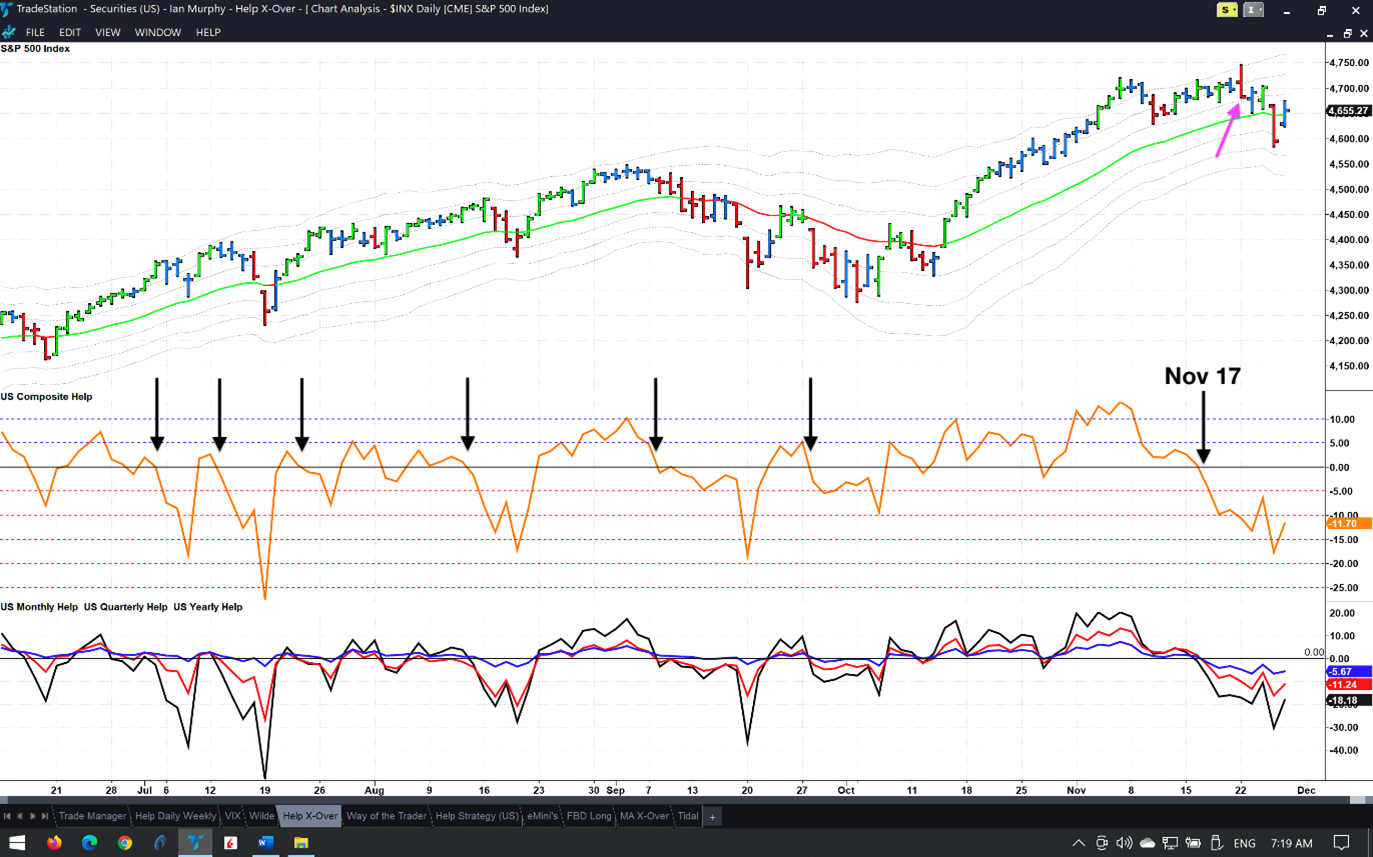
When Composite crosses below the zero line, the market pulls back in the following days (black arrows) and when it crosses back above zero again, the market recovers. The timing is not always perfect, but it works enough times to sit up and take notice.
Composite crossed down on November 17, two days before the upside reversal bar (pink arrow) began the current pullback.
Help Strategy
They say you should make hay while the sun is shining, and the Help Strategy certainly did that. Also based on an analysis of stocks making new highs and lows, the bull trigger on October 14 was stopped out on November 10 for a gain of 11.4% on ProShares Ultra S&P 500 (SSO).
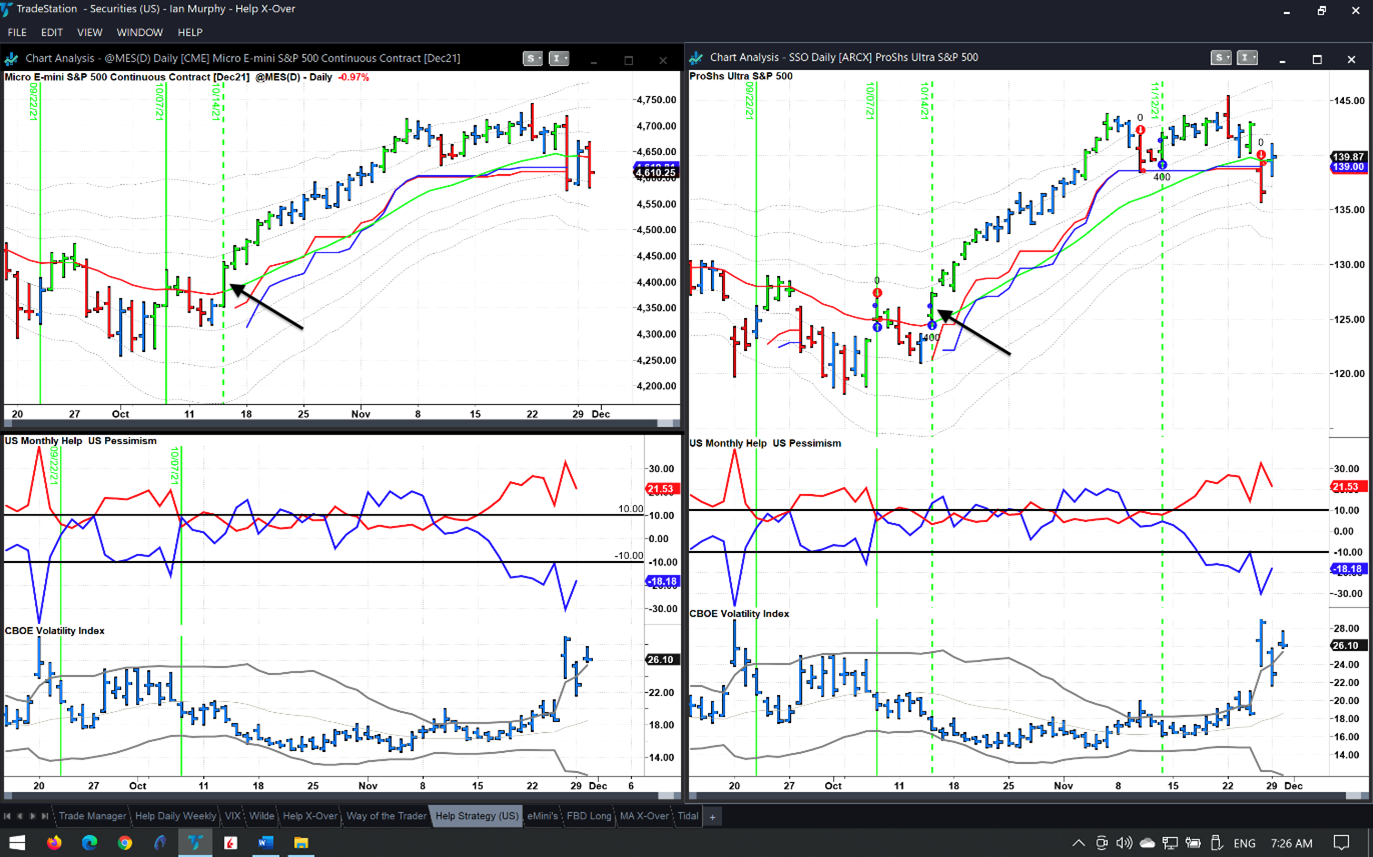
Another bull trigger formed two days later on SSO but that was stopped out on Friday, along with the Micro E-Mini trade which gave 4.3% profit. The most recent trigger on SSO offered enough upside momentum to scale out part of the position, but I held the entire position throughout in my personal account.
The opening price of SSO on Friday gapped over the protective stop but I managed to get a better fill than the original stop price by temporarily moving the order. This is about the only time we should move a stop, and it comes with added risks. I recorded the trade at the open and the video has been added to the Online Trading Course.
FBD Strategy
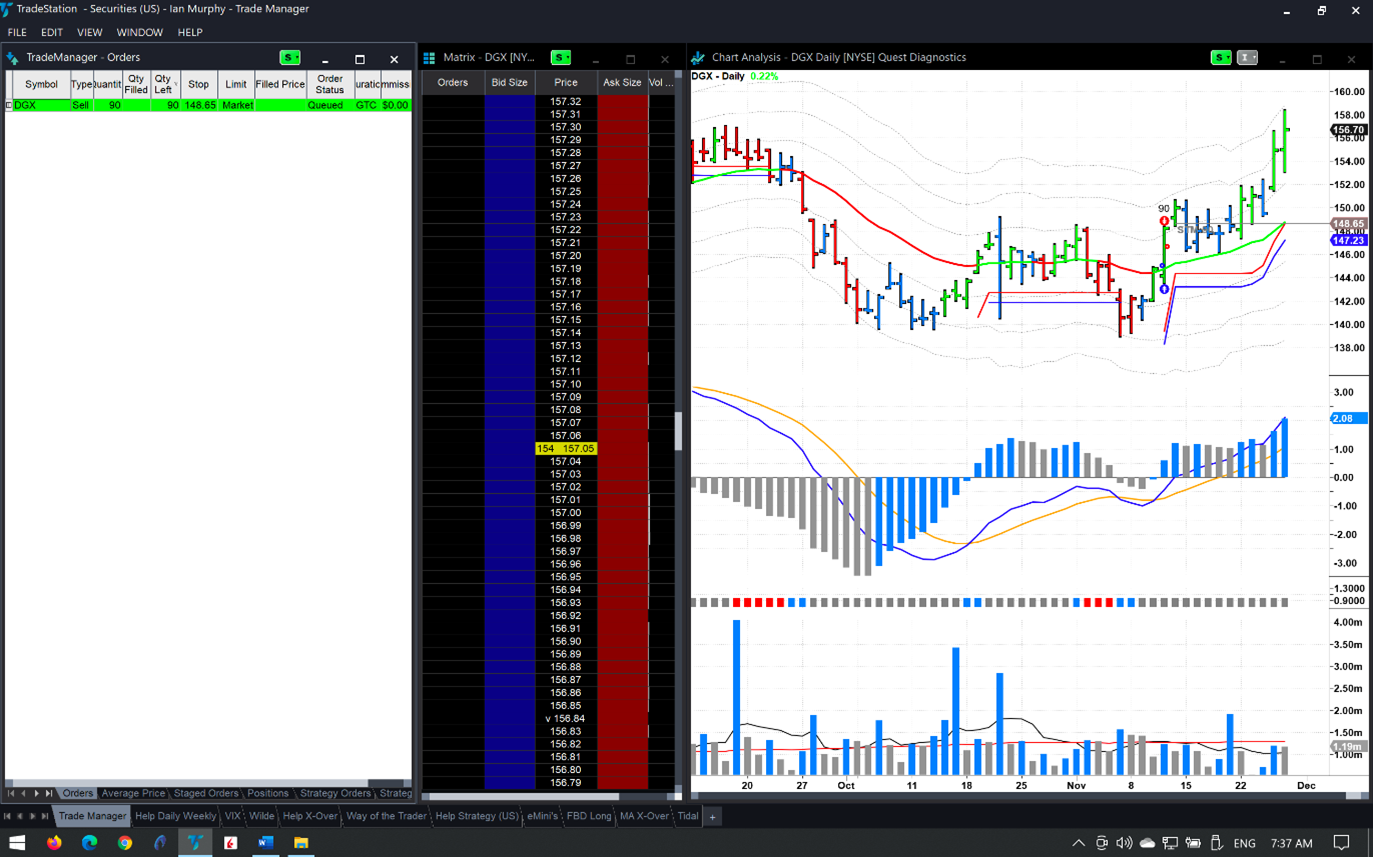
After Friday’s selloff there is only one daily swing trade open on this strategy. Part of the original position has been taken off the table after a 1ATR move to the upside, and I continue to trail a stop under 90 shares in Quest Diagnostics (DGX).
Apart from that, the remainder of the account is sitting in cash as I closely monitor the indicators for new opportunities.
Learn more about Ian Murphy at MurphyTrading.com.


