

The bull market is hanging on by a thread as epic crosscurrents attack traders from all sides, says Joe Duarte of In the Money Options.
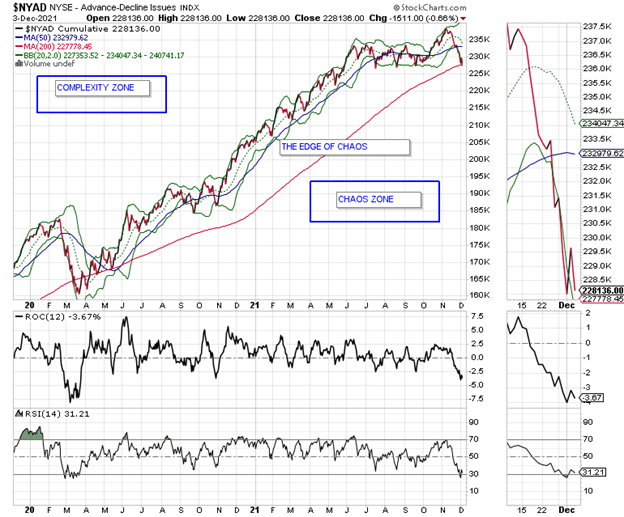
Just when the hedge funds and the algos panicked last week, stocks predictably found support at the 200-day moving average for key indices and indicators such as the New York Stock Exchange Advance Decline line (NYAD, see below). Meanwhile, the short sellers were taken to the woodshed.
But, if history is any guide, this isn’t quite over yet. So, once again, the question that we face as investors is: Do we buy the dip; yet again?
And the answer is, yes. But maybe not so fast. And maybe not all at once.
In other words, given the fact that the inmates (algos) are now running the asylum, any buying should be done in a measured way with the full knowledge that any bounce may be short lived and that until proven otherwise, the odds of the markets making significant new highs are unknown.
That’s because the Fed is hellbent on tapering and because we have yet another version of chaos—the Omicron variant of Covid—on the loose; whatever that means. Moreover, as any investor who’s awake during the trading day knows, the algos react faster than the eye can see and what might have been a winning position can turn into a big loser faster than the eye can blink.
As I noted last week, this is how the market works in an algo run world:
- Headlines hit.
- CTA algos react to their instructions and buy or sell stocks and stock index futures.
- Order flows skew in a certain direction.
- Options markets react.
- Market maker algos hedge against losses.
- Big scary move in the stock market develops.
- Rinse, repeat.
So, as long as you keep in mind that the market runs on the whims of the algo programmers and you act accordingly, you’ll be able to trade more successfully.
Welcome to the Edge of Chaos:
Lennar Breaks Out as Expectations of Panic Home Buying Lift Homebuilder Stocks
I recently recommended shares of homebuilder Lennar (LEN) as the stock broke out from an intermediate term consolidation pattern. As of this writing, the trade is working. But of course, tomorrow, things may change.
But here is why I like the homebuilders now, and perhaps over the intermediate term.
A Window of Opportunity for Homebuyers Creates a Profit Opportunity for Homebuilders
Complexity and supply and demand are lining up in a favorable pattern for homebuilders.
With the Federal Reserve doubling down on tapering, and perhaps raising interest rates by 2022, anyone who’s failed to buy a house and has the means to do so seems to be getting off the fence; a fact that has lit a fire under the homebuilder stocks.
Certainly, the reasoning behind the rally is complex, and has an inherent timing component associated with it. In the first stage, the bond market bets that when the Fed tapers/hikes interest rates, the economy will suffer. And while the second stage can take some time to develop, if it goes far enough the economy suffers, and eventually opportunities decrease for both homebuilders and homebuyers.
Nevertheless, in the early stages of the process, the odds are more favorable for builders and buyers because as the bond market prices in an economic slowing, bond yields fall, which in the short term leads to falling mortgage rates. And it is during this early stage of the process that homebuyers make their move and homebuilder's benefit.
And while I could write about how Lennar’s management is brilliant and has done all the right things, and how earnings look poised to move higher, along with other bull market metrics that move stock prices higher, none are more important than the fact that supply and demand favor homebuilders for the foreseeable future and that the relationship between the bond market and the Fed have given companies like Lennar a gift of sorts—which may be temporary.
In addition, barring an all-out MEL (markets, economy, people’s life decisions) crash the homebuilder stocks are more likely to move higher over time than other sectors because the supply and demand equation is in their favor.
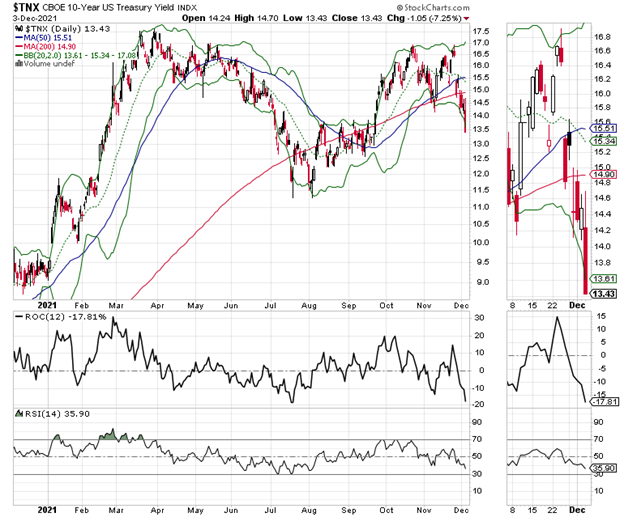
Therefore, as long as bond yields don’t rise rapidly, or climb above 1.75-2%, and as long as the macro environment based on the population’s migration away from high crime, high tax cities, and high tax states continues, homebuilders will be in a better position than other areas of the economy.
I own shares of LEN as of this writing.
Implied Volatility and VIX Remain High but the Market is Trying to Put in a Bottom
Last week I wrote “with IV topping out near 20 for SPY, if we see a move lower in CBOE SPX Volatility Index (VIX) here, it could mean that a bounce is likely. “And that’s exactly what happened when the VIX rolled over, which is a sign that put volume is falling and stocks rallied in a huge way. But, once again, IV pushed higher as the put volume rose and stocks once again struggled.
And here are the details of how this works:
- Call buyers force market makers to sell calls.
- Market makers hedge their call sales by buying stocks and stock index futures.
- The cycle self-reinforces as long as call buyers persist, and the stock market moves higher.
The opposite is true when put buyers are in charge as they were.
In other words, a preponderance of bullish option traders (call buyers) usually means rising stocks and high numbers of bearish option traders (put buyers), which usually lead to lower stock prices.
So, what happened is that the put buyers became exhausted and call activity had a greater effect on the market. This forces short covering, and the market bottomed.
The chart of the VIX and the S&P 500 (SPX) (top panel) shows the following:
Rising VIX usually leads to lower SPX, while falling VIX usually leads to rising SPX. That’s due to rising VIX signaling high put volume. See above for what high put volume means.
So, what we’re seeing is a market that is trying to put in a bottom. If VIX breaks out to new highs and SPX breaks down, expect things to get worse in the short term.
Stock Market Tests Critical Support and a Failure Could be Very Painful
The New York Stock Exchange Advance Decline line rolled over two weeks ago and followed through on 11/26/21 with a break below its 50-day moving average. But although the line remains well below the 50-day line, it has not broken below the 200-day line. However, if it does so convincingly, there could be much more trouble ahead for stocks.
Moreover, NYSE remains oversold with RSI near 30, which suggests that any new low may be a final capitulation move, which could be a prelude to a rebound.
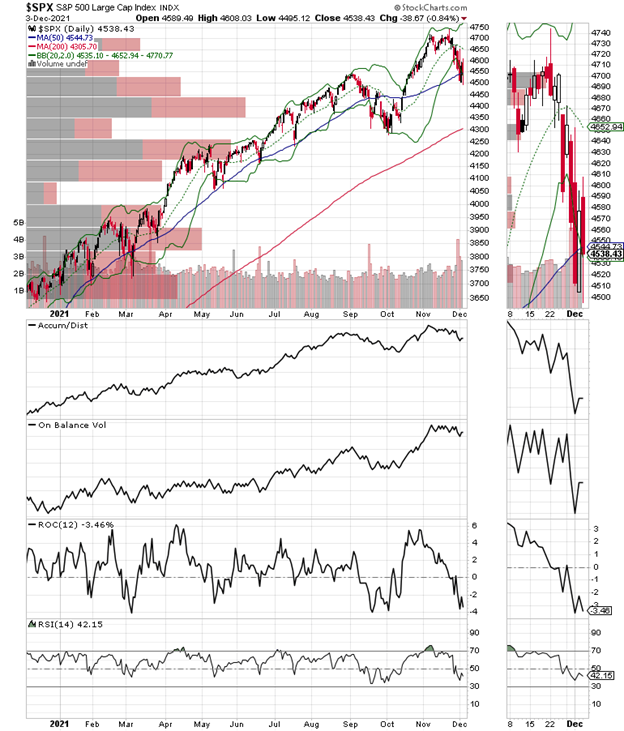
The S&P 500 is oversold and testing key support at 4500 near its 50-day moving average.
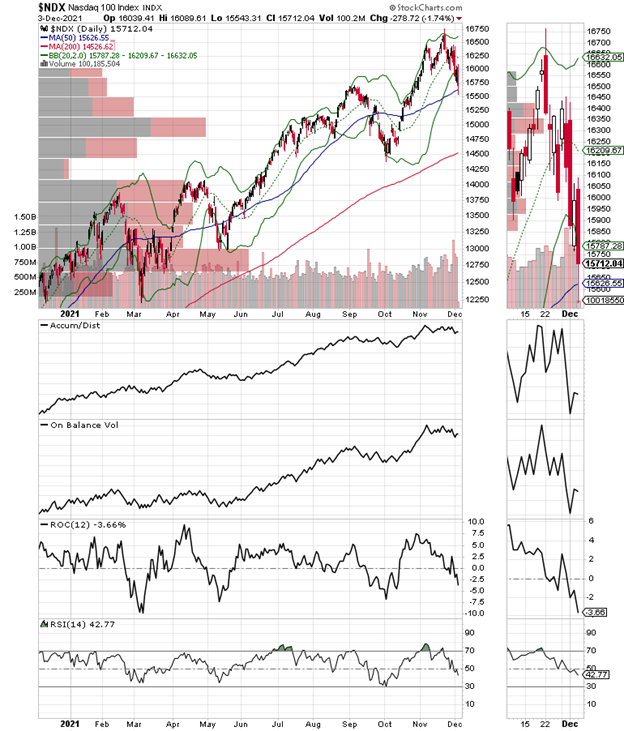
The Nasdaq 100 index (NDX) survived a test of its 50-day moving average last week.
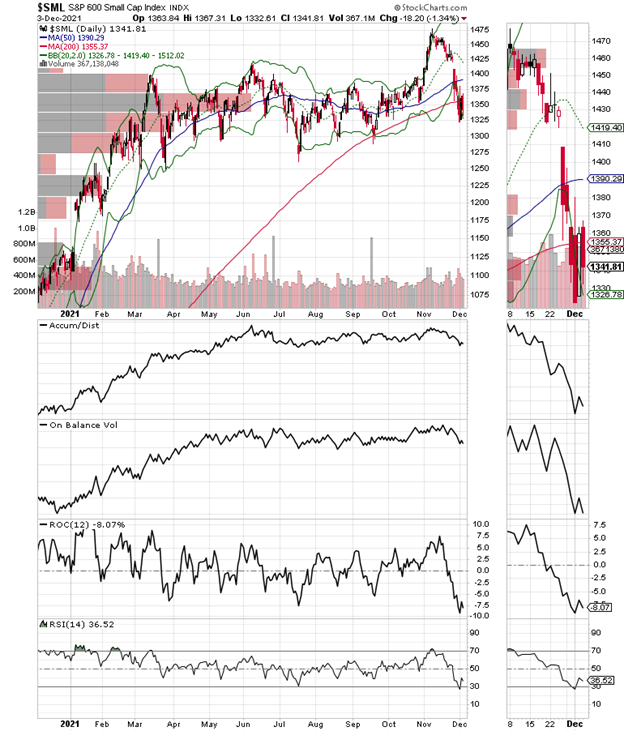
The S&P Small Cap 600 Index (SML) is doing the worst of the major indexes as it is testing its 200-day moving average.
To learn more about Joe Duarte, please visit JoeDuarteintheMoneyOptions.com.


