

We may have a situation developing folks. We have dueling central banks as the Fed’s still tapering, while China’s central bank is easing as the Evergrande default unfolds, says Joe Duarte of In the Money Options.
So, who’s money printing presses are going to win this round?
And if that doesn’t make for some head scratching, consider the fact that while some stocks are sporting delicious price charts, others look plain awful. In addition, as I discuss below, there may be more awful ones than good ones as the market’s breadth looks a bit worn out all of a sudden.
So, Where Are We?
The stock market has clearly made a bottom and is trying to move higher, as the major indexes worked off a very oversold reading via a face-ripping short squeeze. Certainly, this was not a big surprise, as I’ve noted here over the past few weeks. But when all the noise has been cleared, stock traders, humans, and algos are still faced with one simple fact. If a rally is going to continue, real buyers need to step in after the short selling is exhausted.
All the same, it remains a market where investors who are willing to dig deeper into individual sectors and companies are likely to be rewarded—unless, of course, the Fed really steps into it and decides to taper more aggressively than it has already predicted, as the Chinese central bank fails to ease in a big enough way to counter the Fed.
MP Materials: A Rarity and a Potentially Huge Mover in the Rare Earth Minerals Sector
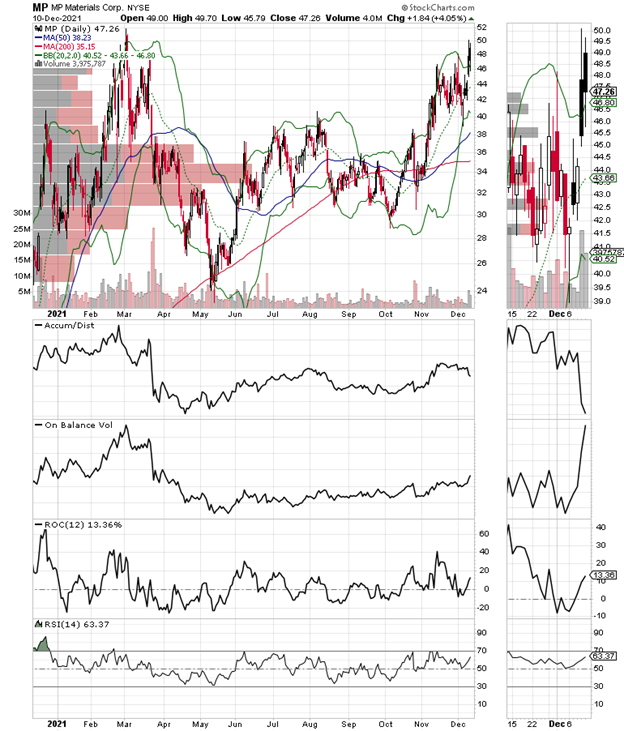
I recently recommended shares of rare earth miner MP Materials (MP), and the stock looks poised to enter what could be a long term uptrend.
Yes, I know. Regular readers are shocked, as this is probably the first mining stock I’ve ever recommended. And like all mining stocks, this one has risk associated with it. But, because it is also a unique situation, it’s worth considering and perhaps being a bit more patient than usual as we wait for the trade to develop.
So, why is MP so unique? It’s because MP owns the Mountain Pass rare earth mine, located some 50 miles south of Las Vegas. Moreover, it’s the only operational rare earth mine in the Western Hemisphere.
And why is this huge? Because the largest producer of rare earth minerals in the world is China. And so, MP is for all intents and purposes the only game in town for companies who may not be willing to cut deals with or reduce their China exposure. Of course, it’s not a pure China avoidance play as China does own a small portion of the Mountain Pass mine. But China’s involvement, as best as anyone can tell, is small enough for GM to note and to diversify its supply chain by cutting a multi-year deal with MP.
That said, for those who may not be in the know, rare earth minerals are crucial in the development and manufacture of high tech products such as semiconductors, lasers, and magnets. In other words, think electric vehicles, cell phones, navigational systems and many other high tech applications.
Moreover, with Samsung Electronics (SSNLF) and Texas Instruments (TXN) building mega semiconductor plants in Texas by 2024 and with GM’s announcement of breaking ground EV factory in Fort Worth, it’s pretty clear that MP’s profile is about to rise to a new level.
Now, given all the geopolitical maneuvering around the world, it doesn’t take much to figure out that if something was to disrupt the ability of businesses to work with China, MP would be sitting pretty. In fact, GM announced a major long-term deal with the company on 12/9/21, which given the current state of affairs in the world, could be the first of many similar developments.
The stock, which I recommended on 12/8/21, one day before a nice move up on the GM news, is certainly tracing out a bullish pattern with the $50 price area being crucial price resistance. Boty Accumulation Distribution (ADI) and On Balance Volume (OBV) have been moving quietly higher of late, suggesting the shorts are squeezed and that buyers are moving in.
I own shares of MP as of this writing.
Implied Volatility Crashes and VIX Rolls Over Suggesting Calmer Market for Now
With the Implied Volatility (IV) for S&P 500 ETF Trust ETF (SPY) options falling and the Volatility Index (VIX), a measure of put volume crashing, it looks as if the market may calm down in the short term. Of course, things can change, and with the Fed still looking to start tapering, both of these indicators will be high on my watch list.
Remember, the options market is a huge influencer of stock prices because market makers are forced to hedge their market making activities in order to preserve their solvency. Here are the details of how this works:
- Call buyers force market makers to sell calls.
- Market makers hedge their call sales by buying stocks and stock index futures—this causes the market to rise.
- The cycle self-reinforces as long as call buyers persist, and the stock market moves higher.
The opposite is true when put buyers are in charge, as they were until 12/2/21. In other words, when put volume rises, it’s because market makers are having to hedge their bets against traders who are betting against the market. This causes VIX to rise, which in turn signals that the odds of a down market are rising.
So, when there are lots of call option traders, expect rising stocks. Meanwhile, high numbers of bearish option traders (put buyers) usually lead to lower stock prices.
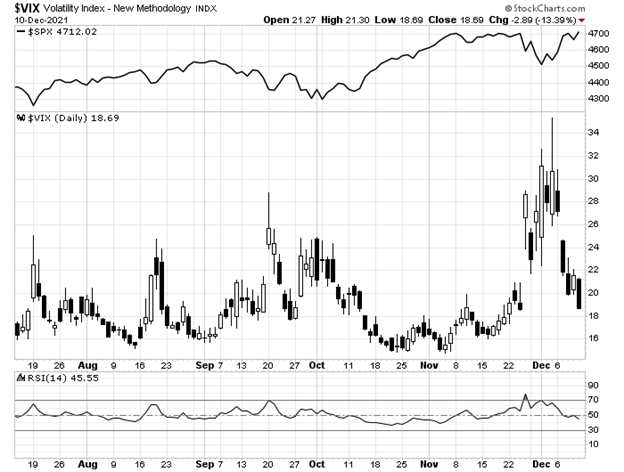
The chart of the VIX and the S&P 500 (SPX) (top panel) shows the following:
Rising VIX usually leads to lower SPX, while falling VIX usually leads to rising SPX. That’s due to rising VIX signaling high put volume. See above for what high put volume means.
So, at this point what we’re seeing is a market that is trying to put in a bottom. If VIX breaks out to new highs and SPX breaks down, expect things to get worse in the short term.
Do We Have Another NYAD Divergence Developing?
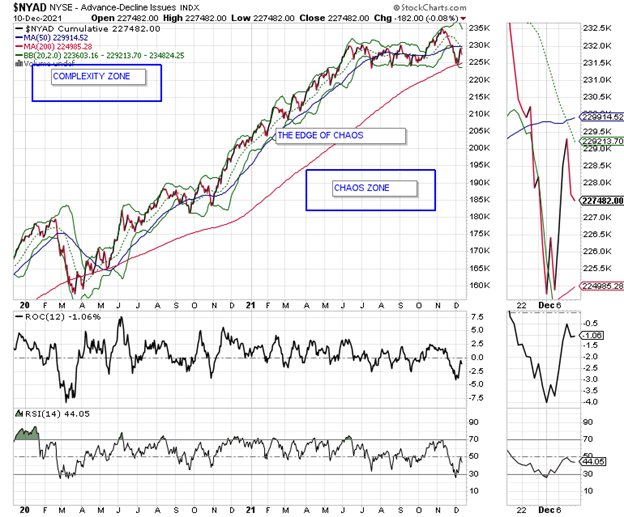
The New York Stock Exchange Advance Decline line (NYAD) bounced back after the post-Thanksgiving trouncing. But as of 12/10/21 it remains trapped between its 50 and 200 day moving averages, - the proverbial Edge of Chaos.
Moreover, with the improvement we’ve seen in the major stock indexes, we are still in a technical divergence. All of which means that we are not out of the woods yet. On the bright side, the Bollinger Bands (green bands above and below NYAD) are starting to shrink, which means that a big move is likely on its way. Hopefully, it will be toward the upside.
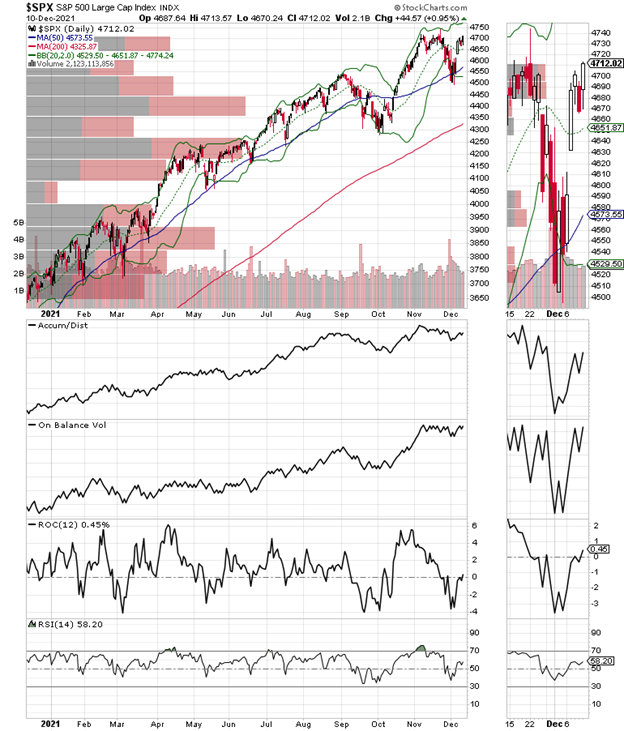
The SPX found support at 4500 and is back above 4700, but has not made a new high off of the recent bottom yet. On Balance Volume (OBV) and Accumulation Distribution (ADI) suggest the rally has been mostly short covering based.
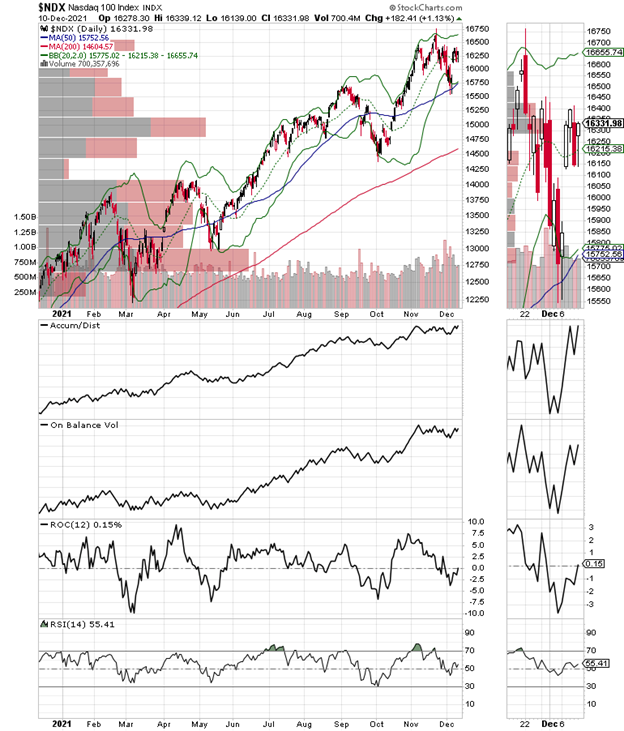
The Nasdaq 100 index (NDX) is not as close to a new high as SPX. However, its ADI and OBV are in better shape, which suggests that there is a better underlying tone in technology than meets the undetailed eye.
Meanwhile, the S&P Small Cap 600 index (SML) continues to lag the market, although it has moved back above its 200-day moving average. If there is a silver lining here, though, it’s in that ADI is moving lower suggesting short sellers aren’t giving up, while OBV is moving higher, which means that dip buyers are active. In other words, unless something changes here, prepare for a short squeeze.
To learn more about Joe Duarte, please visit JoeDuarteintheMoneyOptions.com.


