

Monday’s price action nudged the bear’s cage, and yesterday’s selloff gave it a good rattle, states Ian Murphy of MurphyTrading.com.
The changing market sentiment caused me to root out a chart I haven’t consulted in a while—the percentage of stocks trading above their moving averages.
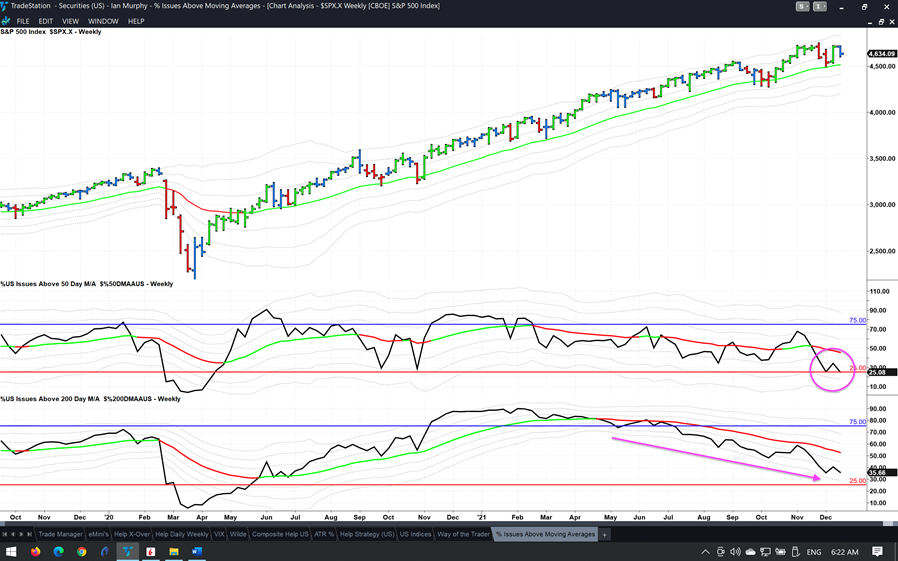
When 75% of all US stocks are trading above their 50-day moving average on a weekly chart, it’s bullish, below 25% is bearish. Currently we are back at the 25% level for the second time this month (pink circle).
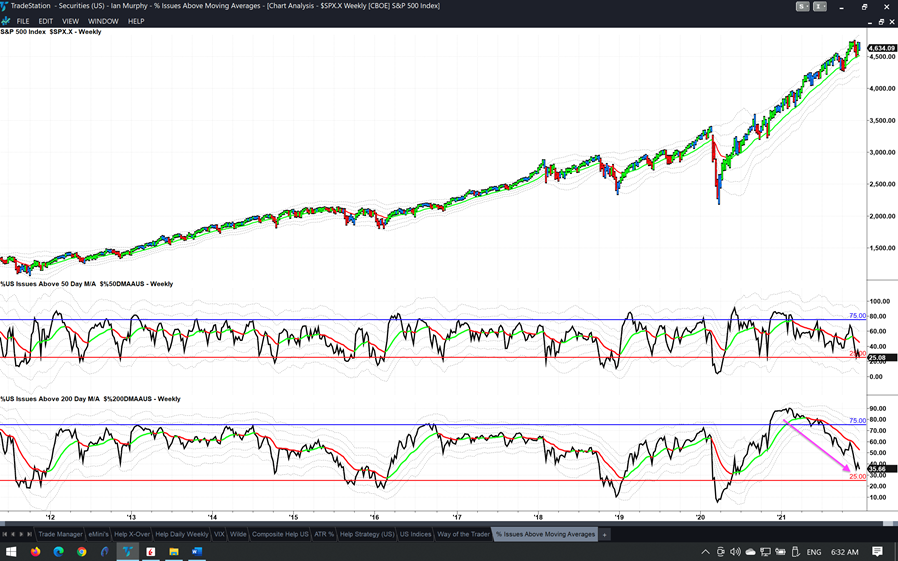
Looking at a longer time frame on the same chart, the rate of decline for stocks trading above their 200-day moving average is alarming (pink arrow)—it has fallen steadily from 90% to 35% since February. If that isn’t confirmation of a bear awakening, I don’t know what is!
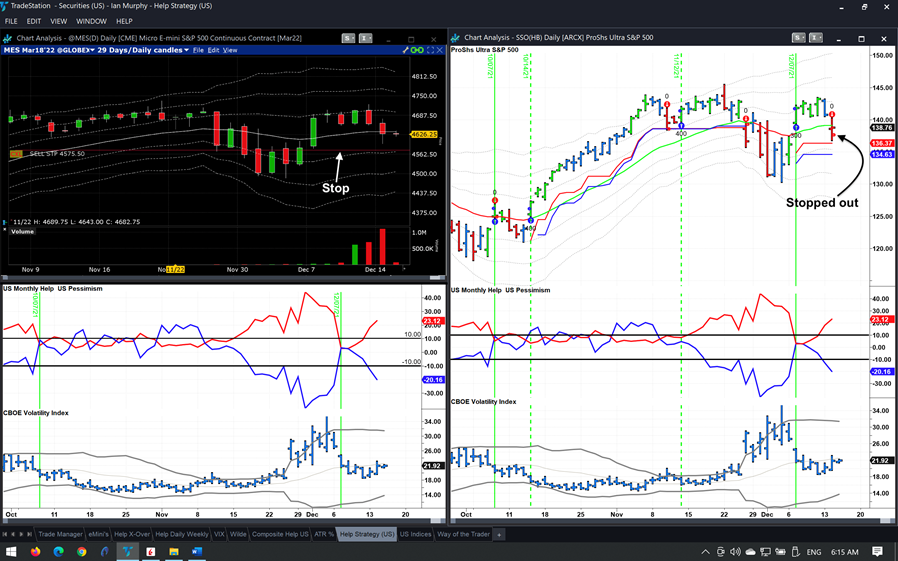
The Help Strategy trade in SSO (top right) was stopped out yesterday when the initial protective stop was pierced. The Micro E-Mini trade is still open (top left). Neither trade had sufficient movement to the upside to allow for scaling out because the bounce was short lived and failed to get established above the 1ATR channel on either instrument—another bearish sign.
Learn more about Ian Murphy at MurphyTrading.com.


