

The stock market has been beaten up a bit to start the new year, but tech managed to stage an interesting reversal, explains Jeff Greenblatt of Lucas Wave International.
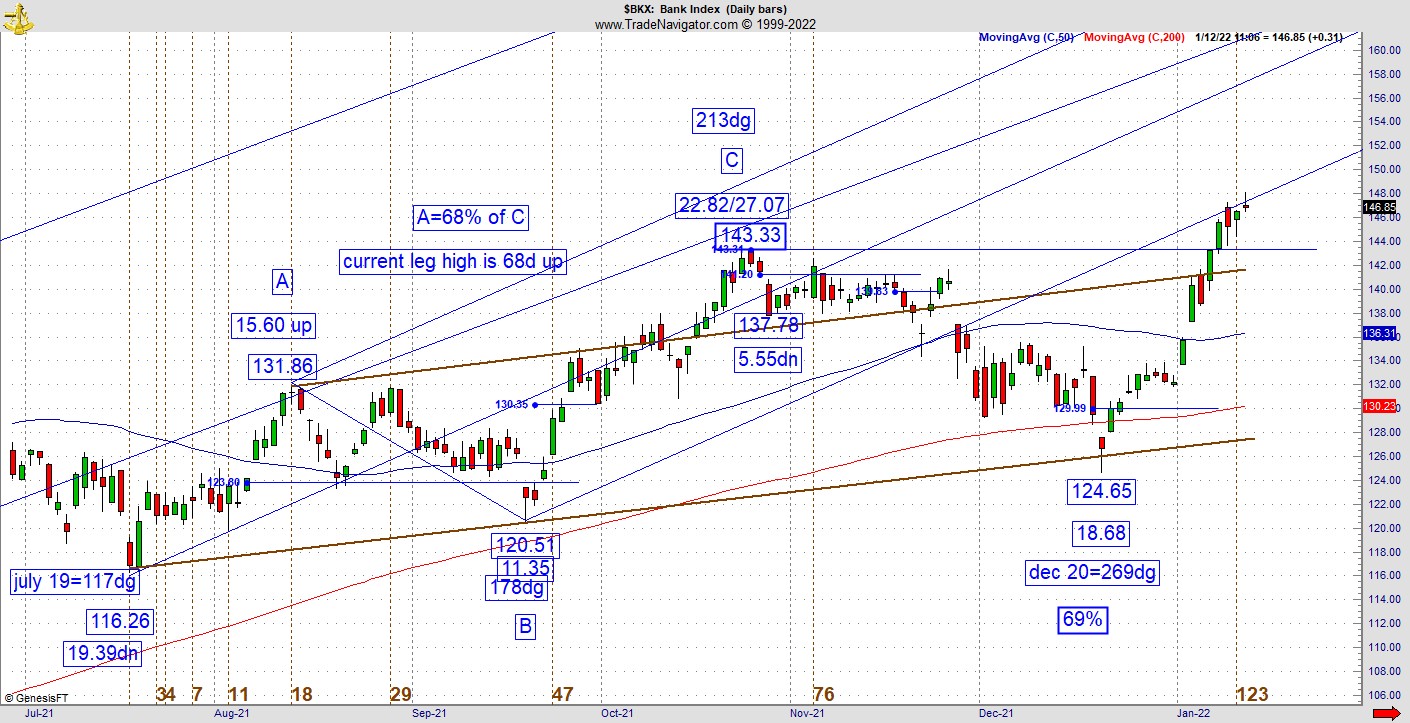
I want to show you an interesting square out every week. That being said, I racked my brain to figure out a good vibration for the low on my Dow futures trading charts, but I was not impressed because I did not find anything noteworthy. Last week I showed you the KBW Nasdaq Bank Index (BKX) conditions, and true to form, it broke even higher. Today we have an updated BKX chart.
When I see a reversal, I have to put the x-ray machine on the chart and sometimes dig really deep to find if there is anything worthwhile. I never know what I’ll find, but if the Dow futures didn’t do it, maybe the NASDAQ-100 (NDX) would.
There it was.
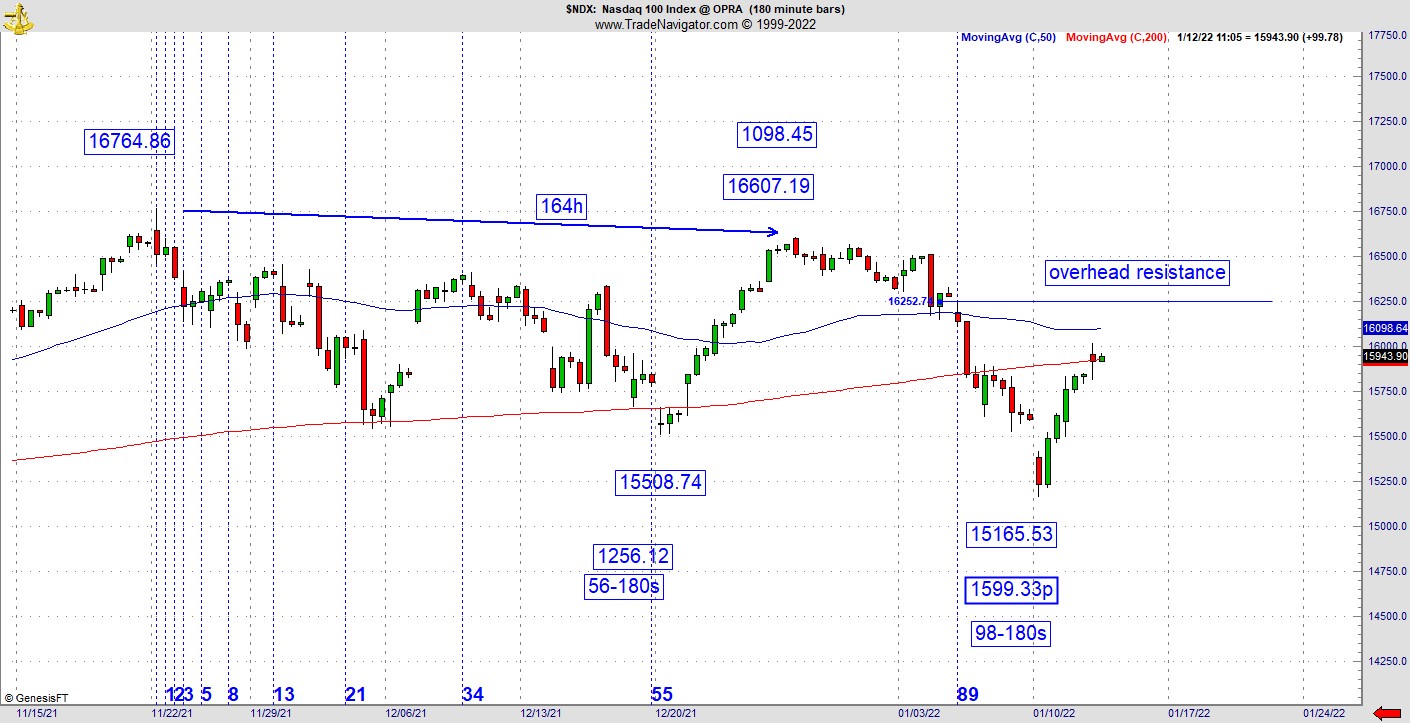
Here’s your reversal. From the top on November 22, the pattern was down 1599 points and change against 98-180 minute bars. This isn’t scientific because we are dealing with nonlinear math, so it’s based on years of observation of these patterns and tendencies. I’d give this reversal a B or B+. It’s got potential, but more importantly, the banks are involved. If I have to pour any cold water here, it’s the Transports that are currently only going sideways.
The bottom line for me is the NDX is looking down at the 200dma, looking up at the 50 with a big ridge of overhead resistance. Let’s be clear, lots of things can still go wrong as patterns have a strange way of cratering when they hit big-boy resistance.
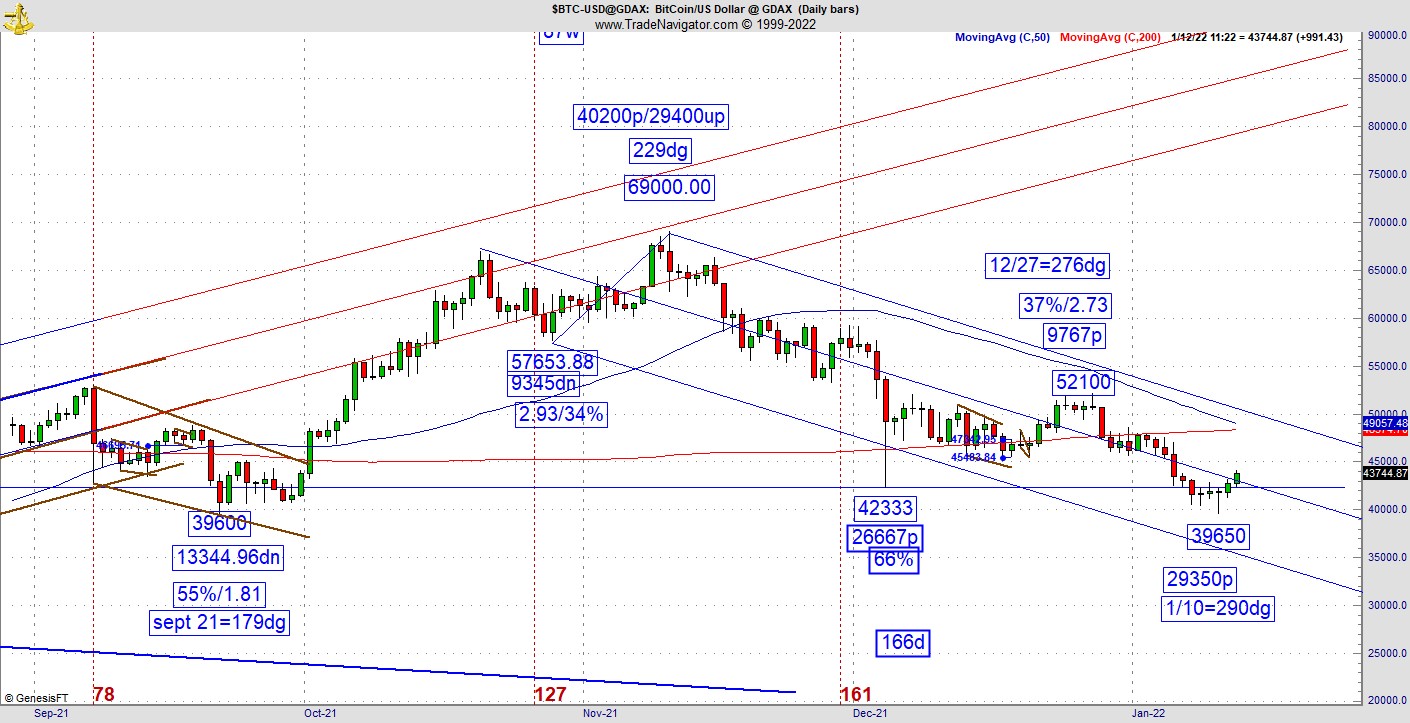
The next topic of interest is the Bitcoin chart, which violated that massive vibrational support area. The calculation for the low is one of the better ones we’ll ever see but the pattern never reacted to it properly. You’ve heard traders talk about patterns that don’t love you back? This is a classic example. What to make of it now? There is a reading for this low but its not nearly as interesting as the one on December 4. The Gann calendar shows us a high November 10, which was the 229dg vibrational day of the year.
The low on January 10 is 290dg. What that means is the selling to this point is a 61dg move, which means there is likely more to this move, but I’d be very cautious until I see it break out of its downward channel lines. I can’t sit here and predict what will happen, but intelligent speculation suggests this turn will give us a test of the 50/200 just overhead as well as the outer channel line. I constantly hear from friends how high Bitcoin is still going from here. That’s all fine and nice, but the chart isn’t telling us that.
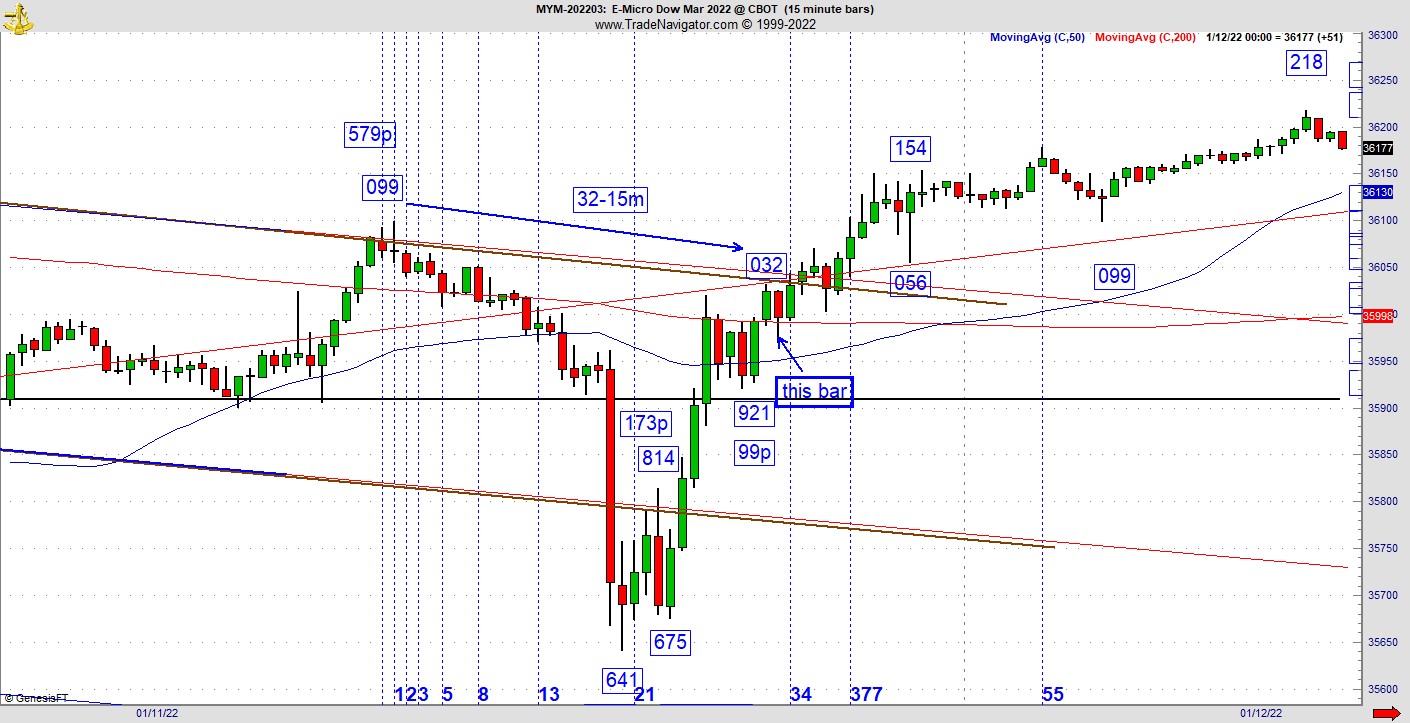
Finally, as traders we don’t learn from our wins as much as from our losses, and on Tuesday, I took one on the chin. I tried a short play, which blew up in my face as a result of the pattern at roughly 32-15 minute bars at a high of 36032 right at a trend line. If you are reading my work for the first time it might be Greek to you. That being said, this is an excellent square out. But nothing works all the time. I lost 64 points in less than the time it takes to boil water. It was not fun. At times like these one has to figure out what went wrong. It was a bullish reversal day, but I look to the pattern as an intraday trader I’m looking for a move of a few bars, which could add up to a lot of points. A few extra red bars would’ve been simply fine. But it wasn’t to be. As you can see, there was a big red bar, but my mistake was not waiting until it completed. It was a big red bar, which created a bearish engulfing configuration. Here’s my problem. On the back end of that bar, it left a lower tail. Had I waited the full 15 minutes, I wouldn’t have taken the trade. So, what is the lesson?
It seems to me when we take trades because we think the train is leaving the station without us, those situations never seem to work out in our favor. So, I actually sold the low (which doesn’t happen to me very often), and before I knew it, the pattern was hitting new highs again.
So, here’s an advanced view of trading square outs. If a particularly good setup that usually works ends up failing it means something much bigger is going the other way. That’s exactly what happened here. This is the beauty of trading in a chaos nonlinear fashion. How to stay on the right side of the market? Sometimes it requires observing how a good vibrational square out plays out. With rare exception, when an outstanding reading does not work, it usually means there is something bigger working in the opposite direction.
We have a good test right now in Bitcoin, let's see how it plays out.
For more information about Jeff Greenblatt, visit Lucaswaveinternational.com.


