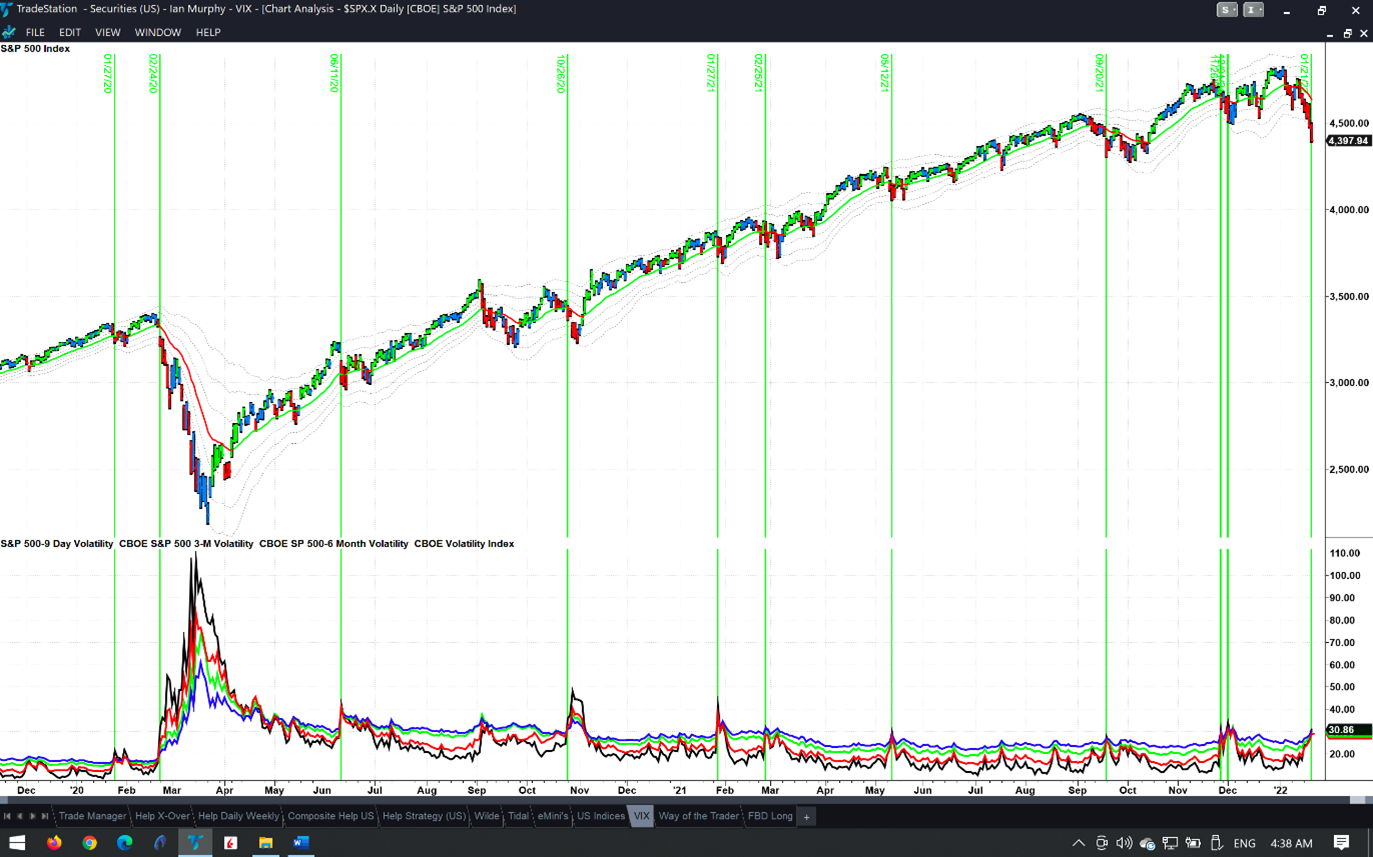
Since Covid-19 emerged in late 2019, nine-day implied volatility of the S&P 500 (black line) closed above the 30-day, three-month and six-month readings on 11 occasions (green lines), states Ian Murphy of MurphyTrading.com.
Based on options pricing (what market participants think will happen) and commonly known as the COBE SPX Volatility Index (VIX), these are usually a reliable barometer of market sentiment. A crossover of the shortest timeframe (nine-day) typically accompanies a selloff in the index within a few days of the pullback beginning.

Click chart to enlarge
The current correction began on January fifth, and surprisingly another 11 trading sessions passed before the nine-day crossover occurred last Friday. This slow response to the correction suggests investors and traders were in denial about the underlying market issues but were finally forced to accept the truth on Friday. This is a problem, because it suggests people were unprepared for the current situation and might start to panic now.

Click chart to enlarge
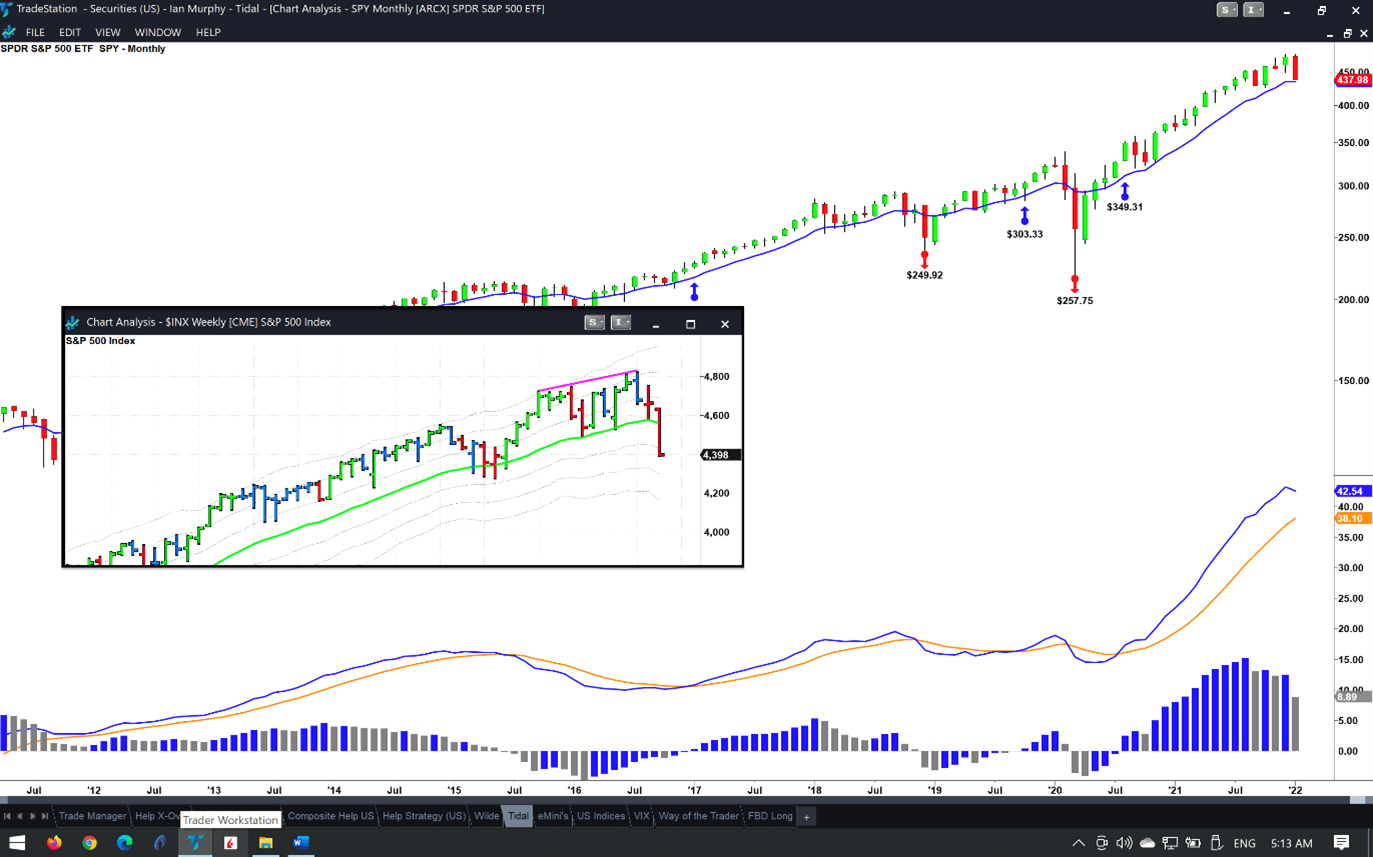
As highlighted in Friday morning’s note, the S&P 500 closed below its -1ATR line on a weekly chart (insert). The next line in the sand is a monthly chart, and the S&P 500 ETF (SPY) used to back test the Tidal strategy closed just $2.64 above the 10 period EMA.
Earnings reports will continue this week, and anything less than stellar numbers may be another excuse for sellers of stocks to dominate.
Learn more about Ian Murphy at MurphyTrading.com.


