

The stock market decline continues in 2022, its worst week since October of 2020, states Bonnie Gortler of bonniegortler.com.
None of the eleven sectors rose, with three sectors performing worse than the SPDR S&P 500 ETF Trust (SPY) -5.75%. Defensive sectors Utilities (XLU) and Consumer Staples (XLP) held up the best, while Technology and Consumer Discretionary (XLY) were hit the hardest.
S&P SPDR Sector ETFs Performance Summary 1/14/21 - 1/21/22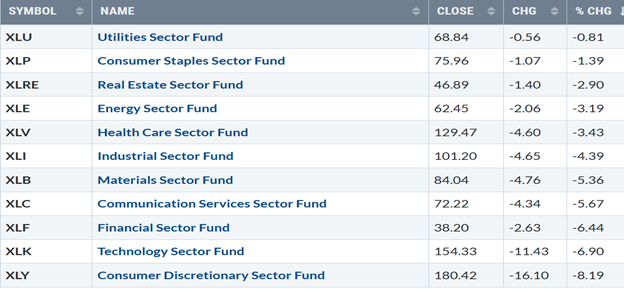
Source: Stockcharts.com
Figure 2: Bonnie's Mix of ETFs To Monitor
Summary 1/14/21 - 1/21/22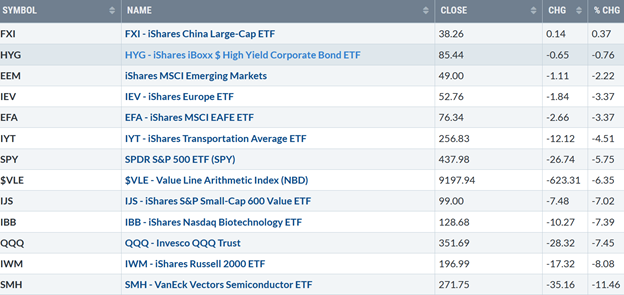
Source: Stockcharts.com
China (FXI) had a small gain, and Emerging Markets (EEM) are improving in relative strength compared to the S&P 500. On the other hand, Investors gave up on Small Caps, and they lost their love for Semiconductors.
All major averages were sharply lower for the week. The Dow fell -4.58%, the S&P 500 was down -5.68%, and the Nasdaq was down -7.55%. The Russell 2000 Index fell -8.07% and the Value Line Arithmetic Index (a mix of approximately 1700 stocks) fell -6.07%.
Figure 3: UST 10Y Bond Yields Daily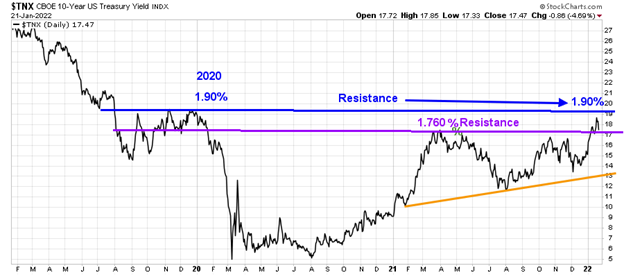
Source: Stockcharts.com
10-Year US Treasury yields peaked intraday on 1/19 at 1.874%, finished down for the week closing at 1.747%, closing near March 2021 highs. Resistance is at 1.90% (Figure: blue arrow).
Weekly market breadth continues to be a significant concern with fewer new highs and more new lows. The New York Stock Exchange Index (NYSE) had only 339 advances and 3263 declines. Nasdaq had 581 advances and 4633 declines. There were 150 new highs and 651 new lows on the NYSE, and 163 new highs and 1645 new lows on the Nasdaq. Without an improvement in market breadth, the decline could accelerate.
Market Sentiment Implies Short-Term Bounce is Promising
Figure 4: AAII Investor Sentiment Survey Week Ending 1/19/22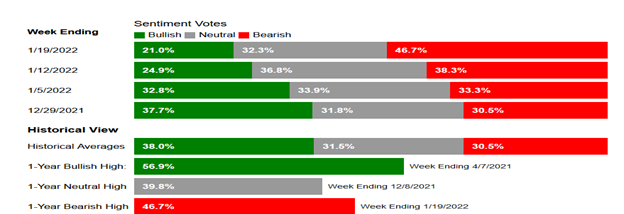
Source: aaii.com/sentimentsurvey
Market Sentiment (a contrary indicator) as of 1/19/22, the AAII Investor Sentiment Survey (AAII) Bulls fell to 21%, falling to an 18-month low. Optimism was last lower on July 29, 2020 (20.2%). Bearish sentiment rose 8.4 points to 46.7%, the highest level of pessimism since September ninth, 2020, at 48.5%.
Figure 5: CNBC Fear & Greed Index 1/21/22
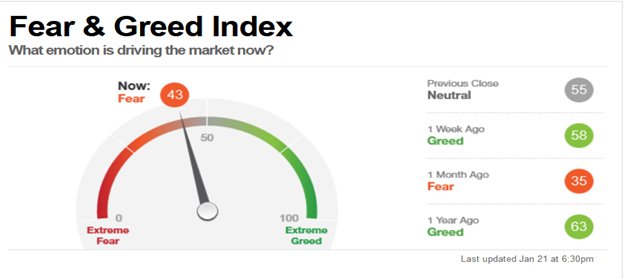
Source CNN Business
The CNBC Fear and Greed Index the previous week was at 58, showing greed. The index now shows fear closing at 43, not yet at an extreme level of fear. However, before there is a bottom in the major average, the Fear and Greed Index is likely to go to extreme fear, but it doesn’t have to.
Figure 6: CBOE Volatility Index VIX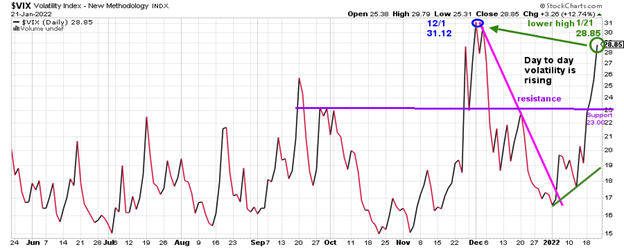
Source: Stockcharts.com
The CBOE Volatility Index (VIX), a measure of fear, rose 50.34%, closing at 28.85 (green circle), the highest close since 12/1/21 at 31.12% (blue circle). Expect the day-to-day volatility to continue as long as VIX remains above 23.00.
Figure 7: Ugly Day on Wall Street 1/21/22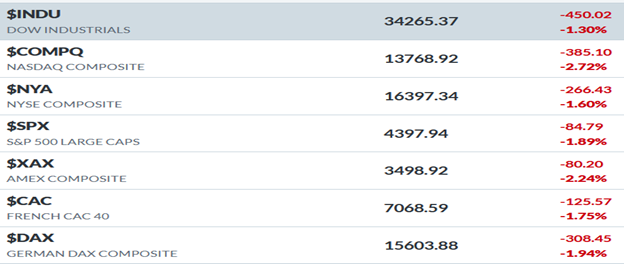
Source: Stockcharts.com
On an ugly day on Wall Street, investors dumped stocks and prices plunged as options expiration accentuated the decline on 1/21/22. Both international and US markets were under heavy selling pressure falling over 1%. There was heavy volume on the Nasdaq and NYSE, including record volume in QQQ Trust, more than any stock and other Exchange Traded Funds (ETFs).
Figure 8: Daily New York Stock Exchange (NYSE) New Lows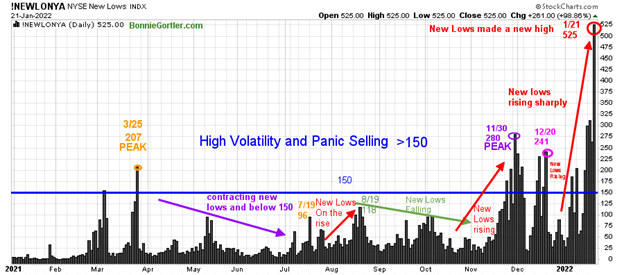
Source: Stockcharts.com
Watching new lows on the New York Stock Exchange is a simple technical tool that helps awareness about the immediate trend's direction. New lows have been warning of a potential sharp pullback, high volatility, and “panic selling” in the near term for most of 2022 closing above 150.
Learn more about the significance of new lows in my book, Journey to Wealth, published on Amazon. Here is an excerpt, "If the new lows are above 50, it is an alert or warning of possible market weakness or a change in market tone. Be aware it's a good idea to make sure you are happy and comfortable with your portfolio. It is best not to have more volatile investments than you can handle where you feel uncomfortable. If the selling continues, you could have serious losses if the market falls further. When new lows are above 150, the market is negative, higher risk, selling is taking place. Sometimes it could be severe, and sometimes on a very nasty day, you can have 'panic selling,' and big wild swings (high volatility) to the downside may occur."
Last week, during the sell-off, volatility rose, and new lows accelerated above the old 11/30 previous peak of 280, closing at 525 (red circle).
If new lows remain above 150, it will signify caution, and the decline has more to go. On the other hand, if new lows on the NYSE begin to contract below 150 and ultimately between 25 and 50, it will imply a short-term bottom is imminent. For now, the risk is high, and expect elevated intraday volatility.
Figure 9: Daily Nasdaq Advance-Decline Line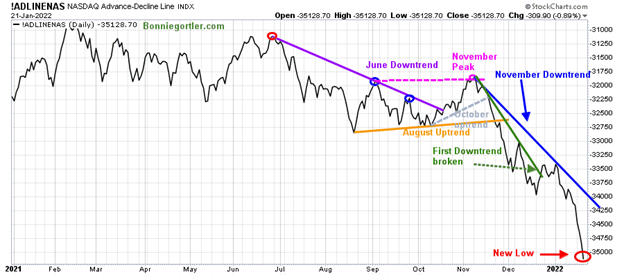
Source: Stockcharts.com
The daily Nasdaq AD-Line broke the June downtrend (purple line), peaking in November 2021, and then turned down, breaking the October uptrend (blue dotted line). Then the August uptrend (orange line), an advanced warning a decline was forthcoming. The first downtrend was broken (green line) in late December 2021 but failed to gain enough strength to break the November downtrend (blue line).
Market breadth continues to be weak in 2022. The daily AD-Line accelerated down, making another new low (red circle), with no sign yet of a bottom. More time is needed to imply the correction is over.
Figure 10: Daily iShares Russell 2000 Price (Top), 12-26-9 MACD (Middle), and Money Flow (Bottom)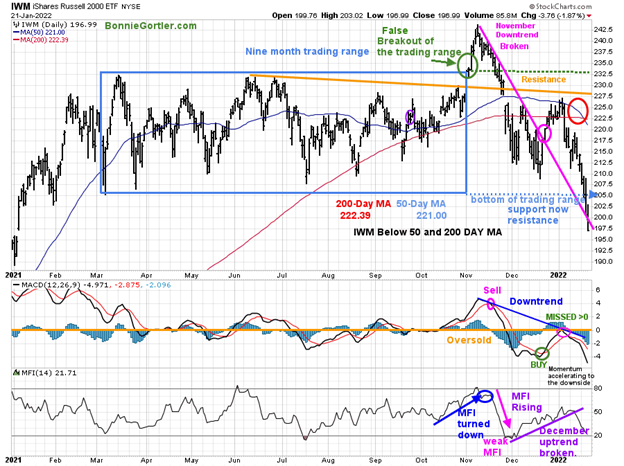
Source: Stockcharts.com
The top portion of the chart is the daily iShares Russell 2000 Index ETF (IWM), the benchmark for small-cap stocks, with a 50-day moving average (MA) (blue line) and 200-day moving average, that traders watch and use to define trends. A false breakout occurred in November in IWM after being in a nine-month trading range. IWM broke the November downtrend but could not get above resistance and turned lower.
IWM remains weak, closing below its 50 and 200-day moving average (red circle), favoring the bears. Once IWM broke below support at 205.00, the decline accelerated as mentioned on the market update 01/14/21, closing down -8.08%, at 196.99, its low. Support is 195.00, last touched in January 2021. Short term downside objective is 178.00. Resistance is 205.00, 210.00, and 220.00.
MACD (middle chart) was too weak to generate a sell, just missing getting above zero in early January, or MACD would be on a sell. MACD continues to accelerate to the downside, with no signs yet of downside momentum slowing.
Money Flow (lower chart) continued to fall after the December uptrend was broken. High risk remains until at least MACD stops falling and begins to flatten and Money Flow turns up.
Figure 11: Daily Invesco QQQ Trust (QQQ) Price (Top), and 12-26-9 MACD (Bottom)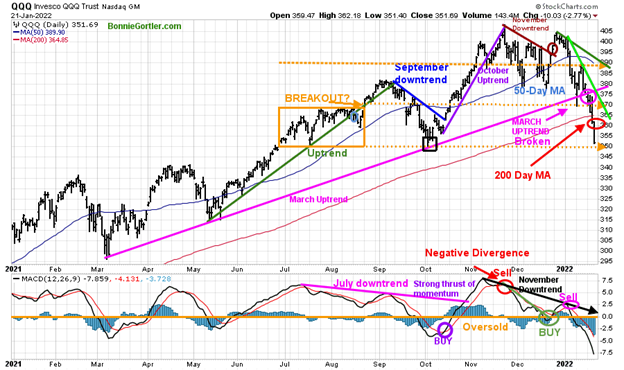
Source: Stockcharts.com
The chart shows the daily Invesco QQQ (QQQ), an exchange-traded fund based on the Nasdaq 100 Index with its 50-day moving average and 200-day moving average. In June, QQQ was in a trading range (orange rectangle), followed by a breakout that failed in late September.
After breaking the short-term downtrend (blue line), QQQ rallied in October and continued to climb in November, barely missing its upside target of 410.00 on 11/22 with a high of 408.71 before reversing lower. In December, QQQ failed to make a new high and broke down below the first support at 390.00, and below the 50-day moving average (blue circle).
Last week, QQQ trend shifted to down after closing below the March uptrend (pink line) at 351.69, down -7.45%. QQQ penetrated key support (mentioned in the update 1/14/22) at 370.00 that needed to hold and accelerated lower on heavy volume.
Resistance is at 360.00, 370.00, followed by 375.00. Support is at 350.00. The next downside objective if QQQ closes below 350.00 is 330.00, followed by 310.00.
The lower chart is MACD (12, 26, 9), a measure of momentum. MACD flipped to a sell the first week of January (pink circle) remains in a downtrend and falling (black line).
There are no signs of diminishing momentum, with MACD making a lower low than in December. On the other hand, MACD is the most oversold since 2021, implying a short-term rally is likely to alleviate the oversold condition. However, risk is high until MACD begins to flatten.
Intermediate-Term Shifted to Negative
Figure 12: Weekly Invesco QQQ Trust (QQQ) Price (Top), and 12-26-9 MACD (Bottom)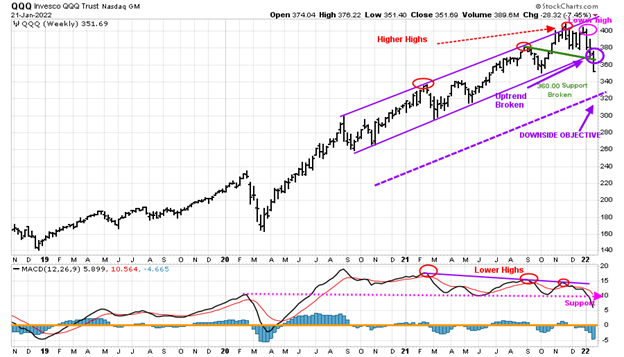
Source: Stockcharts.com
The top chart shows the weekly Invesco QQQ Trust making higher highs peaking in November (red circles) but failed to make a new high in December and then turned down.
Last week the intermediate uptrend since September 2020 was broken (green line), and the intermediate trend is now down. QQQ fell below support at 370.00, and selling accelerated; the downside objective is 320.00 (lower channel).
MACD (lower chart) remains on a sell, making lower highs, weakening momentum, forming a negative divergence (price high unconfirmed by MACD, which is making lower highs). With the decline, MACD closed below critical support area holding since February 2020 (pink dotted line), implying underlying momentum is weak and high risk.
Figure 13: Van Eck Semiconductors Daily Price (Top), 12-26-9 MACD (Middle), and Money Flow (Bottom)
Source: Stockcharts.com
Semiconductors (SMH) broke through resistance in October (green arrow) and surged higher until late November. However, in November, SMH stalled, and the October uptrend was violated (blue line), then a trading range developed. Last week SMH got crushed, falling -11.46% with three levels of support broken, 303.00, 290.00, and 275.00 closing at 271.75. Resistance is at 275.00, followed by 290.00.
MACD (middle chart) remains on a sell, falling, and is oversold below zero. Money flow (lower chart) remains in a downtrend (green line) and oversold in the same area as in October. A turn up in Money Flow and MACD breaking the downtrend together would be a positive sign of a potential rally in SMH.
NYSE AD-Line Breaks Below Support
Figure 14: New York Stock Exchange AD-Line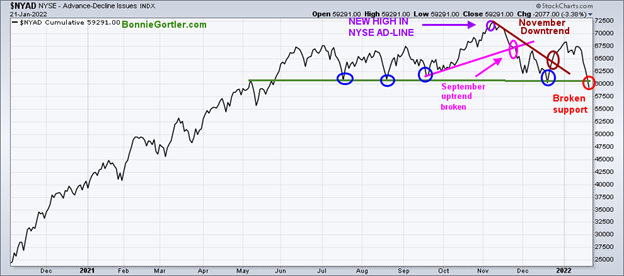
Source: Stockcharts.com
The NYSE A/D line made a new high on 11/8/21. In December, the AD line broke the November downtrend (brown line) and is no longer rising, and it did not make a new high. Without a new high in the AD Line soon, this would be a warning of a pending correction forthcoming in the NYSE. The lows made in July, August, September, and December (blue circles) did not hold, warning further correction may be ahead.
Figure 15: ARKK Daily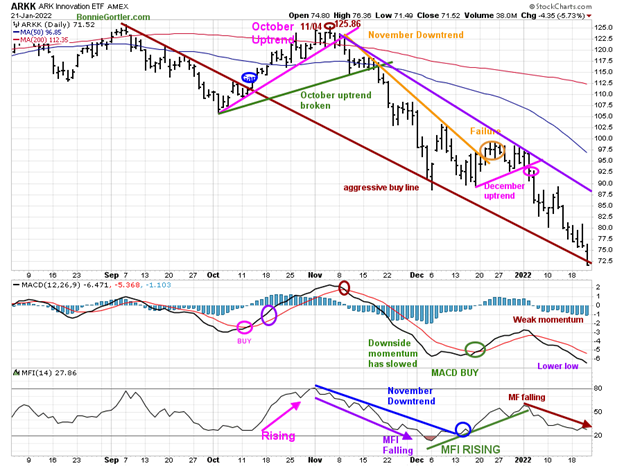
Source: Stockcharts.com
ARK Innovation ETF (ARKK) is an actively managed ETF by Cathie Wood that seeks long-term growth and is highly volatile. ARKK broke its September short-term downtrend (brown line) in October and gapped up (blue circle), followed by a failed rally peaking at 125.86 on 11/04. Once ARKK fell below support at 94.00, it broke through the December uptrend (pink line). ARKK continues to accelerate lower, falling again down -10.87% last week, closing at 71.52. ARKK is worth watching to see if ARKK stabilizes and begins to rise, having successive positive closes as a sign that traders are stepping into buying growth stocks.
MACD remains on a buy because MACD never made it above zero, implying weak momentum. This week, a lower low, taking away the potential positive divergence.
Money flow (lower chart) continues to fall in 2022. Short-term resistance is 82.5, 85.00, followed by 90.00. The aggressive buy of 77.00, not traded since July 2020, was profitable for a few hours, did not hold before ARKK turned lower. ARKK remains high-risk volatile, with the bears in control.
Figure 16: Ishares Transportation Average (IYT)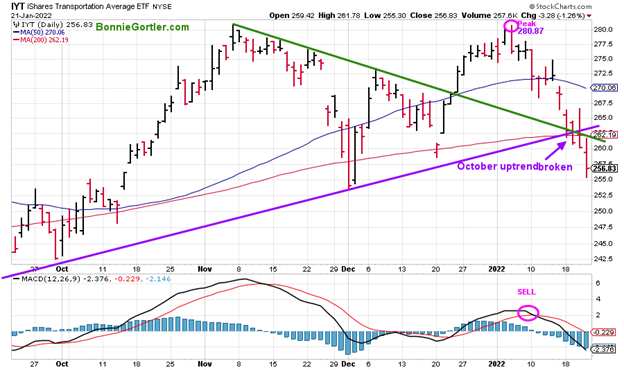
Source: Stockcharts.com
The Transportation Average (IYT) peaked on 1/5/22 at 280.87 and turned lower. Last week the decline accelerated with IYT down -4.51%, breaking support at 262.00 and the October uptrend (from October) shifting the trend to down. The following support is 252.50. A close below 252.50 would imply a test of the October 2021 low.
Updating Financials and Energy
Figure 17: Financial Select SPDR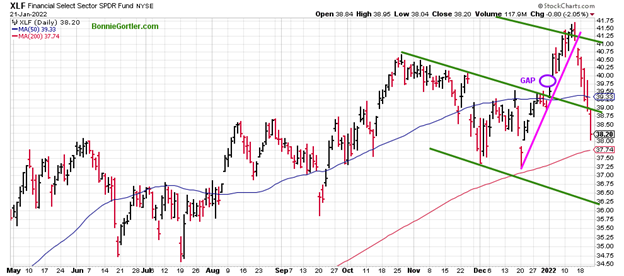
Source: Stockcharts.com
Financial Select SPDR (XLF) also was under heavy selling pressure declining last week after breaking below support at 40.00, 39.00, and below its 50-day moving average. XLF fell - 6.44%, closing at 38.20. Support is at 37.75. A close below would imply a fall to the lower channel at 35.25. Resistance is 39.00, followed by 41.00.
Figure 18: Energy Select SPDR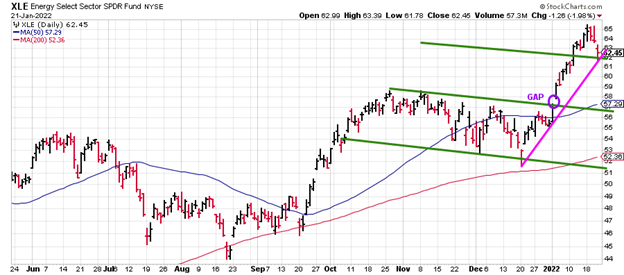
Source: Stockcharts.com
Investors rotated heavily into the Energy (XLE) sector in the first week of January, a strong sector in 2022. However, last week XLE also lost ground down -3.19%, closing at 62.45, holding above the December uptrend and remaining above the upper channel at 62.00. The upside objective remains at 67.00. Short-term support is 62.00, followed by 59.00, and 57.00 in the near term.
Summing Up:
All major averages were down sharply as the decline accelerated and broadened on increased daily volatility. Market breadth on both the NYSE and Nasdaq continues to be concerning. Support levels broke, shifting the intermediate trend to down, joining the short-term trend. Expect high volatility with momentum oscillators continuing to make lower lows, no sign of a bottom yet. However, with market sentiment showing fear and short-term momentum oscillators very oversold, be alert to a short-term bounce that could begin at any time. Risk is high with the bears in control until the bulls come out of hiding, decide prices have fallen enough, and decide to go bargain hunting on a shopping spree. Remember to manage your risk, and your wealth will grow.
I would love to hear from you. If you have any questions or comments or would like to talk about the market, email me at Bonnie@Bonniegortler.com
Disclaimer: Although the information is made with a sincere effort for accuracy, it is not guaranteed that the information provided is a statement of fact. Nor can we guarantee the results of following any of the recommendations made herein. Readers are encouraged to meet with their own advisors to consider the suitability of investments for their own particular situations and for determination of their own risk levels. Past performance does not guarantee any future results.


