

The skies surely turned darker for stock traders on February 4, 2022 as a surprisingly strong employment report led to a major selloff in the bond market, which in turn pushed stocks lower, notes Joe Duarte, technical specialist and editor of In the Money Options.
The bounce I predicted last week certain came and then went. And by Friday, the bond market was well out of control as the January employment report went against all expectations with a headline number of 467,000 new jobs created versus expectations that some cases were in the negative numbers.
But by the end of the day some of the selling pressure had evaporated, begging the question as to what’s really happening inside the market. So as the drama plays out, as I describe below, what’s really happening is that traders are working out whether they should stay or go.
Wiggly Data
Interestingly, there was a lot of whispering on trading desks about the employment numbers, and with good reason. In fact, there is some evidence—courtesy of the BLS itself—that the number was distorted by statistical updates
Indeed, the explanatory language as to how the number was actually derived, can be found in table C of the report. It clearly states that the final number is related to adjustments related to “population control effects,” which BLS defines as “independent estimates" of population used to weigh the household survey sample results to reflect the civilian noninstitutional population, age 16 and older. The US Census Bureau develops the population controls. They are based on decennial census population counts, supplemented with birth and death data and estimates of net international migration.
As far as I can tell, the BLS does not define or clarify what the “independent estimates” are beyond the generic description above, or who makes them.
Of course, my point is not to fault the BLS or the Census bureau, but merely to point out that statistics are only as good as the data on which they are based on.
In other words, even if the estimates are meticulously conducted, because they are based on data from the Census Bureau—which has its own set of estimates—the numbers may already be outdated given that it is possible that they could be based on distorted data or improper sampling, which can happen with any survey.
Just as likely, the data may still in be in flux due to the fluid Covid related pandemic and rapid population changes—deaths, movement to different states, immigration—legal or otherwise.
Thus, because of the complexity of the times in which we live in, there is really no way to know how many new jobs were created in January.
As a result, the Federal Reserve, if they are influenced by this data without diving deeply into the numbers and making appropriate adjustments, may indeed make a significant policy error by increasing interest rates, perhaps by as much as a 0.5% hike in the Fed Funds rate in February.
Still, there were rumors and a report by Reuters in late Friday trading action that the Fed is not planning on hiking interest rates by 0.5%, which likely accounted for the partial recovery on an otherwise dismal trading day.
However, what the Fed is not denying is that higher rates are coming. So, when the Fed pulls the trigger, it should be no surprise to anyone as the central bank has told us for weeks now that it’s going to raise interest rates.
Indeed, higher rates are now the fashion, except in China as the ECB has already forecast its own rate hikes in the not too distant future, and the Bank of England delivered its first rate hike of the cycle recently.
We’re in No Man’s Land
It is what it is for sure. And the Fed’s going to do whatever it wants. But here is what should be of concern to all traders. The markets are now trading on data estimates based on other data estimates that are being taken as gospel truth by algos. What that means is that whatever happens next is completely unpredictable since algos just follow the program and don’t take a step back to make sure that they are truly parsing the data before jumping in.
As a result, investors should maintain a trading, short term, mindset which adheres to the following principles:
- Don’t fight the Fed.
- Don’t fight the market’s momentum.
- If a stock does not get stopped out, keep it until the stop gets hit.
- Look for areas of relative strength in the market as this is where the new leaders will come from—I expect these will decrease, so stay patient.
- Consider options instead of stocks to reduce risk of loss while participating in any potential upside if the market bounces in the short term.
- Keep a short-term outlook on any new trade—long or short.
- Raise cash either by waiting after being stopped out, by not putting large sums to work at the moment—or both..
- And prepare for more trouble ahead.
Welcome to the Edge of Chaos:
“The edge of chaos is a transition space between order and disorder that is hypothesized to exist within a wide variety of systems. This transition zone is a region of bounded instability that engenders a constant dynamic interplay between order and disorder.” —Complexity Labs
Rising Fertilizer Prices Could Boost CF Industries’ Bottom Line
I recently recommended purchasing shares of fertilizer producer CF Industries (CF) as the stock is nicely bucking the general down trend in the market. At this point, this is a classic supply and demand story coupled with a very attractive price chart which shows a stock with strong upside momentum, even in a crazy market. Specifically, nitrogen and natural gas prices, the two most important components of CF’s fertilizer products have been rallying. Moreover, with crop inflation becoming more entrenched and farmers requiring higher amounts of fertilizer due to expectations for higher prices, CF has been able to pass higher production costs onto its customers. This has resulted in $1 billion cash flow over the last year with the company expected to deliver over $2 billion in EBITDA when it reports earnings in mid-February.
Supply Squeeze Should Drive Profits
Here are some take home points from the recent Q3 earnings call which should fuel an excellent Q4 set of results
- High crop prices and increased economic activity continue to drive demand.
- Lower global production and government actions have created a supply constrained global market.
- The company expects the fall ammonia application season will be the largest since 2012—India and Brazil will likely lead the way.
- Fertilizer inventories are very low.
- Global production has been low in 2021 due to severe weather in North America, higher maintenance worldwide, and ongoing European shutdowns and curtailments.
- The Russian and Chinese governments are discouraging nitrogen fertilizer exports through the spring further tightening global supplies.
Price Chart Shows Strong Momentum
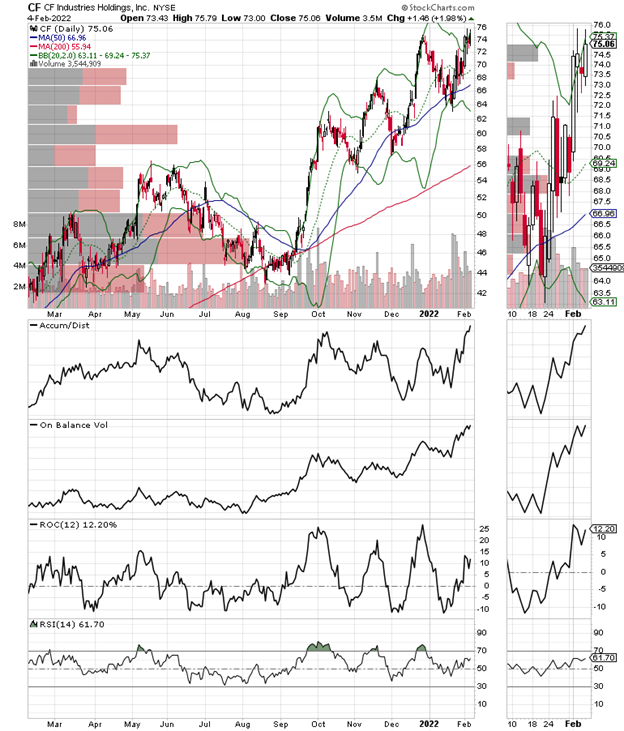
The price chart speaks for itself with positive momentum everywhere. Specifically, Accumulation Distribution (ADI) and On Balance Volume (OBV) are rising while Volume by Price (VBP) shows good support at $70 and no major resistance above $75. In this market, it’s hard to find relative strength, which is why having a small position in CF Industry Holdings with a well placed sell stop makes sense.
I currently own shares in CF.
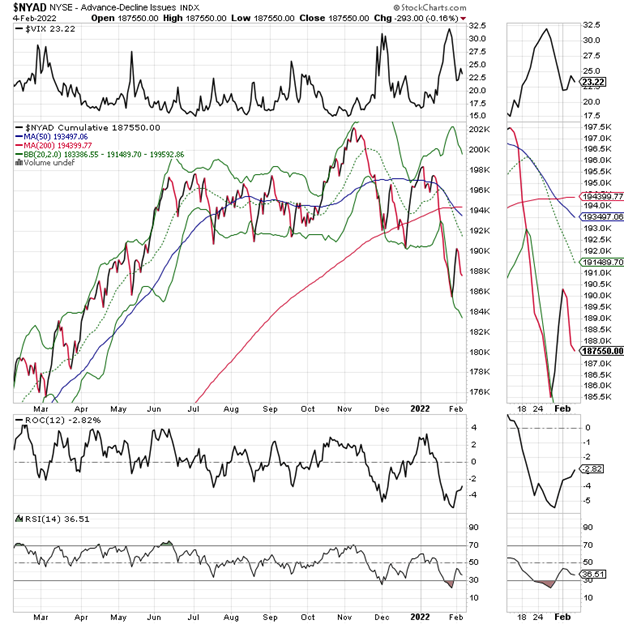
Sellers Seem Exhausted. Market Inside Crucial Decision Zone.
The New York Stock Exchange Advance Decline line (NYA) did not fully recover last week. And it ended the week on a mixed note. But the CBOE Volatility Index (VIX) continues to roll over. That suggests that the market is suffering more from a lack of buyers than from overwhelming action by sellers. So, if this continues, we can expect a continuation of the current choppy market which will bounce around every time a new news item hits the wires.
A rise in VIX signals that put option volume (bets that the market is going to fall) are on the rise. What follows when put volume rises is that rising put volumes cause market makers to sell puts and simultaneously hedge their bets by selling stocks and stock index futures.
Meanwhile, the S & P 500 (SPX) is inside a huge price congestion zone sandwiched between its 20, 50, and 200-day moving averages. On Balance Volume (OBV), and Accumulation Distribution (ADI) suggest money is actually trickling into the index. However, the Volume by Price (VBP, bars on left of chart) indicator suggests that there are a lot of traders in this area and that the direction in which the index breaks, up or down, from here is likely to be very meaningful.
Keep an eye on what happens between SPX 4300 and 4650.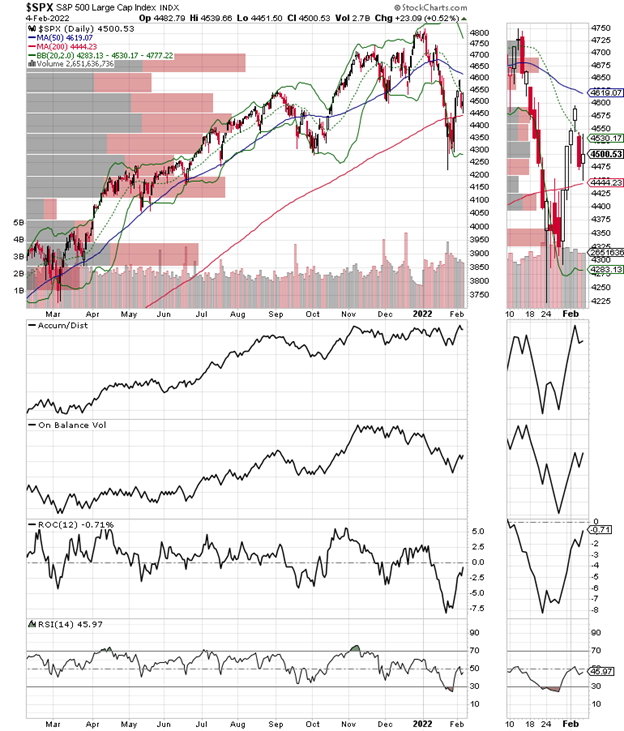
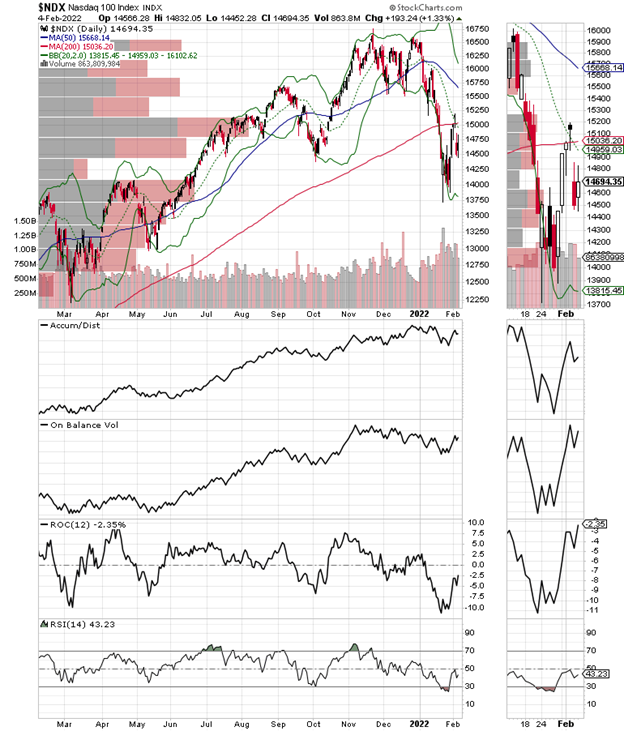
The Nasdaq 100 index (NDX) is in a similar position to the S&P 500, but it is below its 200-day moving average, which means that there are a lot more sellers in technology than in other areas of the market.
Moreover, the largest VBP bar for NDX is at the 200-day moving average, suggesting that this price area is the most important line in the sand.
The S&P Small Cap 600 index (SML) also remained well below its 200-day moving average and is showing no signs of any interest in rising or falling in a meaningful way at the moment.
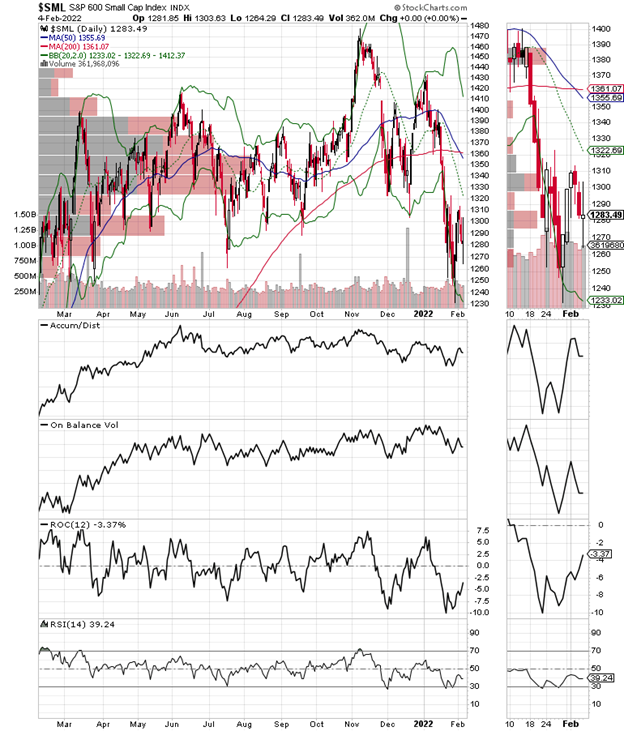
The S&P Small Cap 600 index (SML) also broke well below its 200-day moving average. And although it’s clearly oversold, it could move decidedly lower.
To learn more about Joe Duarte, please visit JoeDuarteintheMoneyOptions.com.


