

The stock market has obviously got a far more bearish tone to it that at any time since early 2020. Does it crash from here? What could bulls hang their hopes on, states Simon Ree of TaoOfTrading.com.
1. Lack of Sector Leadership
Right now, there is no sector of the stock market that looks like it can carry us higher. Energy is the only sector that looks bullish, but it’s too small to do the heavy lifting at only a 3.5% weighting in the S&P 500 (SPX).
The biggest sector by far is technology...and it does not look very promising, closing below its 200-day moving average (200 DMA) again yesterday. Semiconductors are in a similar situation, while software and cloud computing are at or near new 52-week lows.
Other key sectors like healthcare, consumer discretionary and communications are all trading below their respective 200 DMAs as well.
This market map shows the YTD performance of the S&P 500 constituents:
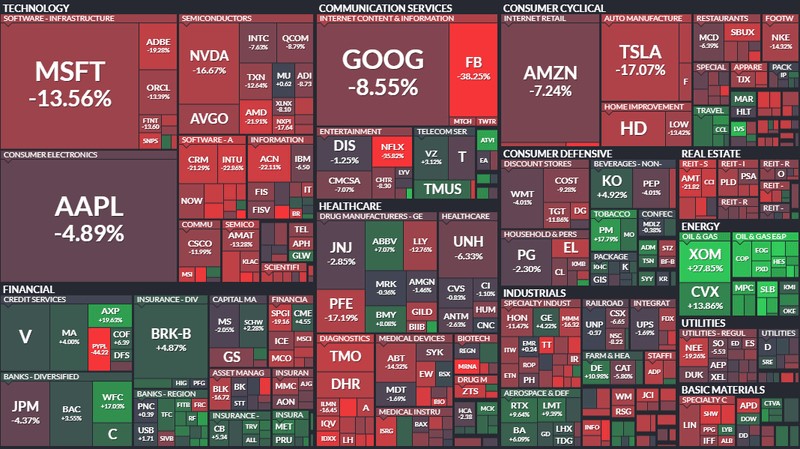
Source: Finviz
Usually there are three to four sectors one could point to that look bullish. Right now, it is only the (rather small) energy sector.
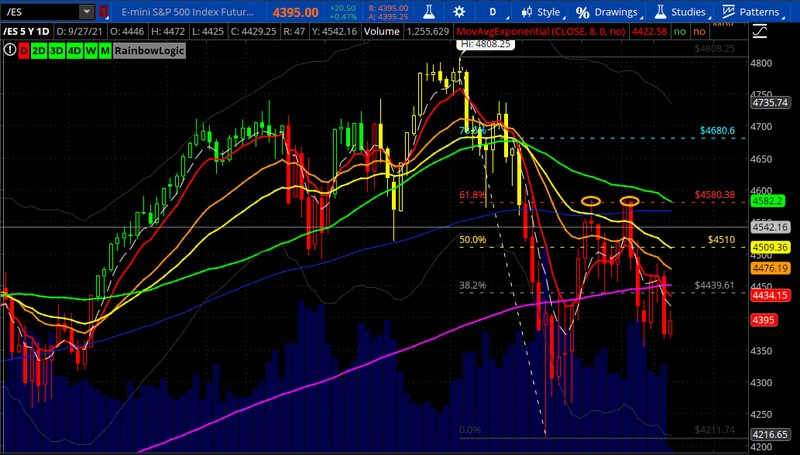
2. Stock Market Technicals: At Best Confused, at Worst bearish
The S&P 500 yesterday closed below its 200 DMA again (I explained why the 200 DMA is kind of a big deal in this post). It has failed three times at the 61.8% retracement level from the all-time high. Another failure below the 200 DMA brings the 24 January low back into focus.
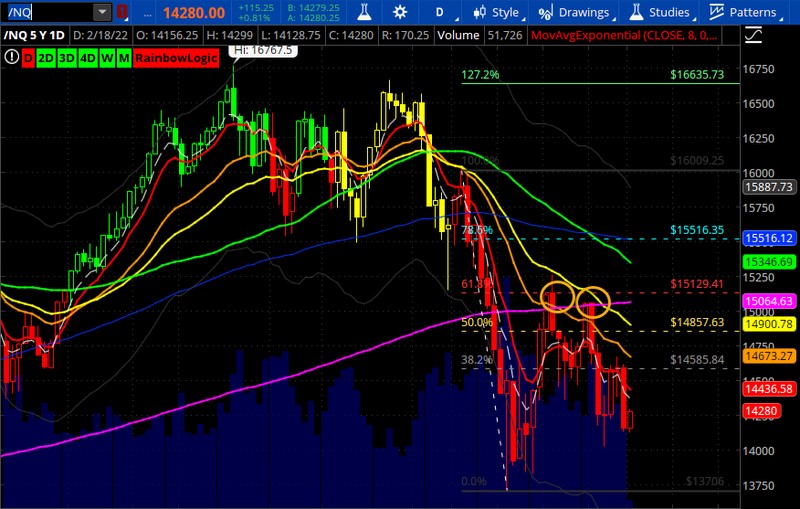
While the S&P doesn’t look bullish, the Nasdaq (IXIC) looks demonstrably worse. Not only has the Nasdaq been below its 200 DMA since January 21, it is finding considerable resistance at the 200 DMA.
3. A Buyer’s Strike
Thursday was a heavy session for the stock market, with the S&P 500 losing -2.1% and the Nasdaq falling -3.0%. The selloff wasn’t on high volume. This wasn’t a panic; it was simply a complete absence of buyers. Not a healthy sign.
Now, we could argue that this is because we have a three-day weekend ahead (market is closed Monday for President’s Day) and nobody wants to hold risk over a long weekend...but will the dip buyer’s show up on Tuesday?
We have February monthly options expiration today which is likely to impact market activity...barring any tape bombs coming out of Ukraine.
4. Bonds Are Due for a Bounce
“What? Are you crazy? Why would anyone buy bonds when inflation is raging at 7.5%?”
The market knows all about inflation. It has been extremely well covered for the past 12 months. The market also knows the Fed has turned hawkish. Fed coverage rivals that of inflation, Covid and the Ukrainian border situation. These things are not surprises. On the contrary, I think the market is now discounting “peak hawkishness”.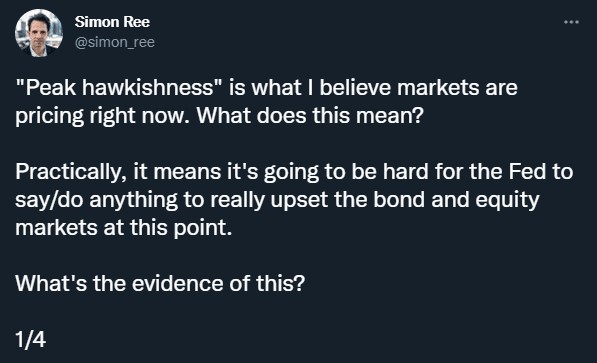
Source: Twitter
Bonds are now a long way below their mean and in my opinion are (over) due for some mean reversion (disclosure: I own call options in Ten Year Bonds (TLT).
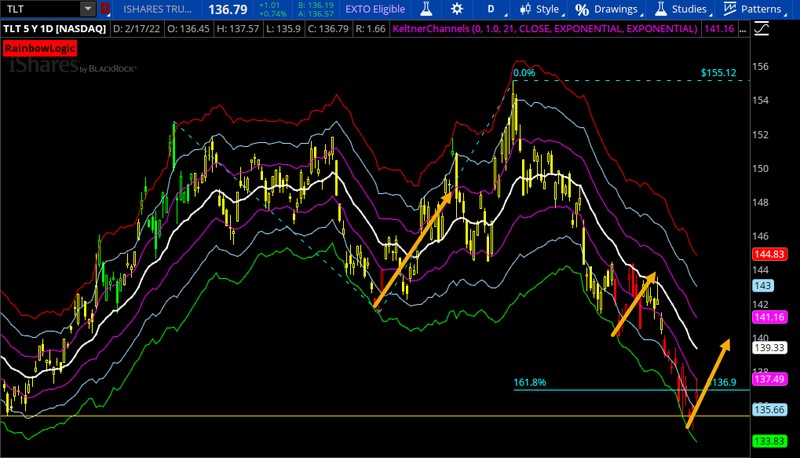
I wouldn’t fall in love with the bullish bond trade though...the downtrend is likely to reassert itself before too long.
5. Implied Volatility Remains Elevated
Implied volatility (IV) on the S&P 500 remains elevated. It’s IV percentile is 93%. This means IV has been lower than current 93% of the time over the past year. IV percentile for the Nasdaq is at 94%.
You want to be careful trading single-legged option strategies in this environment. If you buy a call (or a put) and IV normalizes, your position will make less profit than you would expect and could even end up losing money even if you get the direction right. When IV gets really jacked-up, it becomes an even more important determinant of option pricing. It’s a better idea in this environment to trade spreads. This will help mitigate the impact of paying too much for extrinsic value, which can result in higher theta decay than normal.
6. Stock Market Breadth Remains Poor
I previously wrote about poor breadth in this December article. It really did prove to be the canary in the coalmine...and things have not improved since.
The chart below shows the advance-decline line for the NYSE (DJ). Note the significant divergence in breadth from November to January:
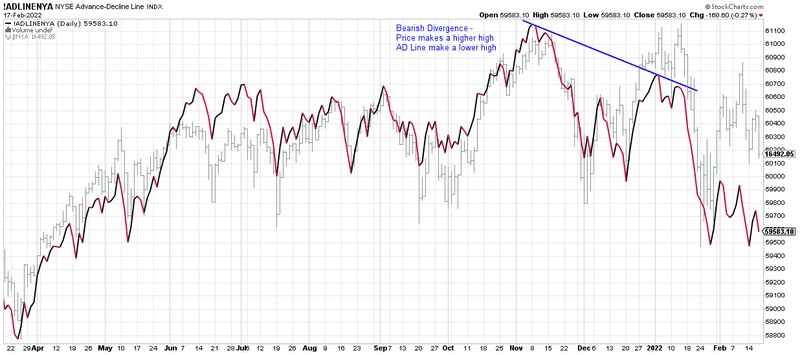
Source: Stockcharts
New lows exceeded new highs 7.5 to one on NYSE yesterday...the ratio was ten to one on Nasdaq.
Meanwhile fully 69% of Nasdaq stocks currently trade below their 200 DMA. If Apple, Microsoft, and Google roll over here, the indices could drop like a stone. Note Microsoft and Google both closed below their respective 200 DMAs yesterday.
It’s unlikely we’ll see a sustained rally until we see some improvement in breadth.
7. Earnings Have Been Decent
With 82% of S&P 500 companies having reported, earnings are on pace to hit a record high for the fourth consecutive quarter.
GAAP EPS are up 68% yoy and operating EPS are up 41%
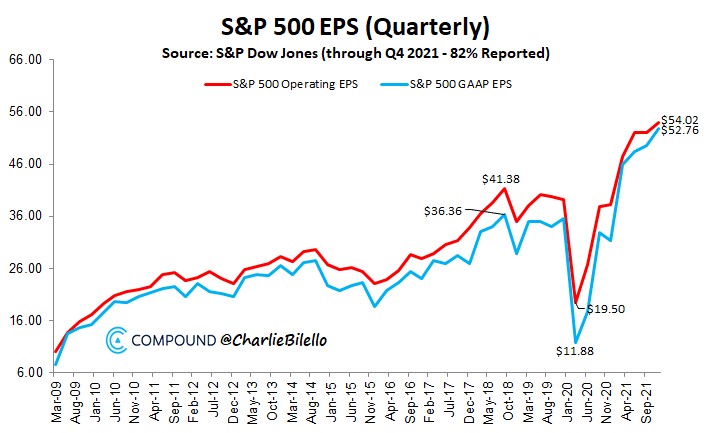
Source: Charlie Bilello
Unfortunately, in an environment like this, good earnings reports largely go to waste as far as share price performance is concerned. A classic hallmark of bear market mentality is good news (e.g. earnings) gets ignored while bad news (e.g. prospect of Fed tightening, Ukraine) gets obsessed over.
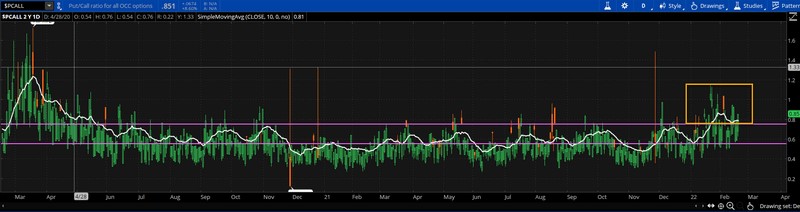
8. We’ve Seen an Explosion in Hedging Activity
As bearish as all of the above sounds, we have seen an explosion in put buying over the past month, relative to call buying (see chart of the put/call ratio below). We haven’t seen put buying like this since April 2020, when market participants were still reeling from the Covid crash. This type of options activity has been a consistent indicator that the stock market is near a bottom:
We have also seen a surge in hedging demand across a range of instruments. Sentimentrader runs a proprietary equity hedging index that includes options, futures, credit default swaps, and inverse ETFs. According to their data, hedging demand is amongst the highest seen over the past 22 years:
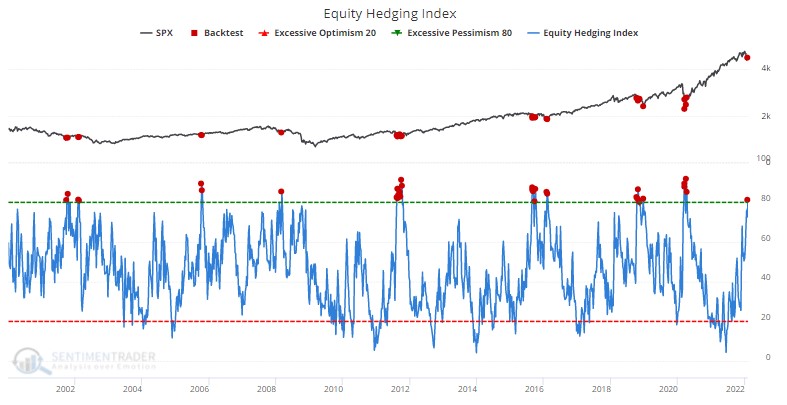
Subsequent returns after similar surges in hedging demand have been impressive:
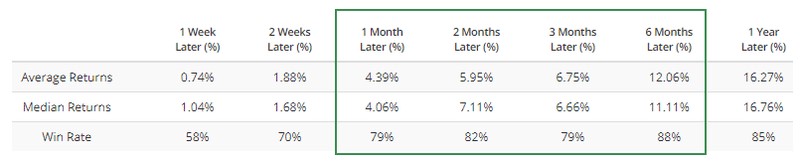
Source: Sentimentrader
Sentiment is also very bearish...and consistent with levels that are more consistent with at least a short-term market bottom:
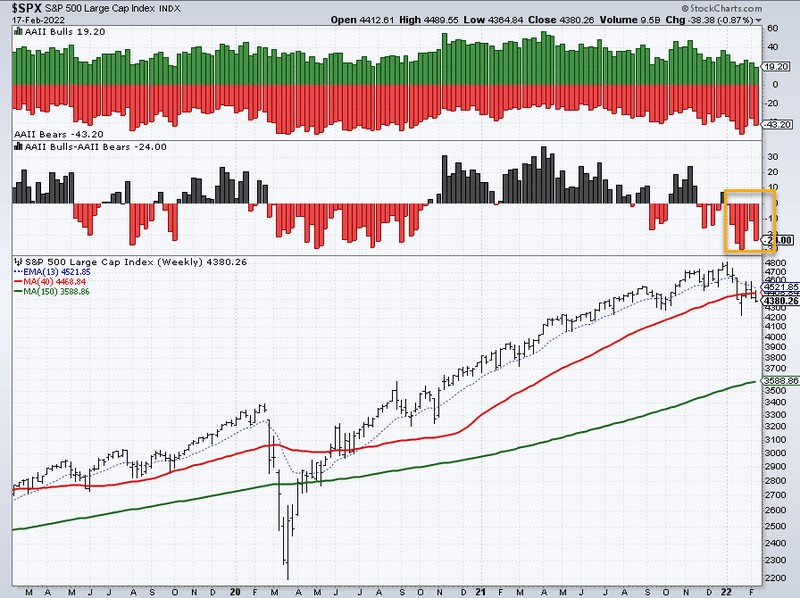
Source: Stockcharts
All this means a short covering rally could be just around the corner. These tend to be sudden and vicious, and if you’re 100% short you get your face ripped off.
9. My Gameplan
So how am I playing this? Well, I only have about 10% of my capital at work right now! I am keeping my positions small and my trading light. The tape is mostly bearish, but sentiment and positioning are bullish. This has me leaning towards getting some more short-term long exposure as we head into next week, without trying for force anything. Uncertainty remains high—the range of possibilities is broad indeed. But if there’s one thing I’ve learned over the last 30 years, it’s getting short with the crowd after a decent selloff is very rarely a winning strategy.
Trading is inherently risky. While a potential for rewards exists, by trading, you are putting yourself at risk. You must be aware of the risks and be willing to accept them in order to invest or trade in any type of security. Don’t trade with money you can’t afford to lose. This is neither a solicitation nor an offer to buy/sell securities. These materials are offered for educational purposes only and no investment or trading advice is being given. No representation is being made that any account will or is likely to achieve profits or losses similar to those discussed on this web site. The past performance of any trading system or methodology is not necessarily indicative of future results.
learn more about Simon Ree at https://www.taooftrading.com/.


