

Bank stocks are sensitive to interest rates and Interest rates are sensitive to the strength of the business cycle, states George Dagnino, chairman of Peter Dag Strategic Money Management.
The attractiveness of bank stocks depends on the trend of the business cycle. Not interest rates.
My article of January 2021 concluded:
“…rising yields at the beginning of a business cycle is good news for bank stocks. Yields rising to levels damaging the economy and causing the business cycle to decline is bad news for the banking sector.”
To recognize what is happening now it is useful to review how the banking sector responds to changes in the business cycle.
Source: The Peter Dag Portfolio Strategy and Management
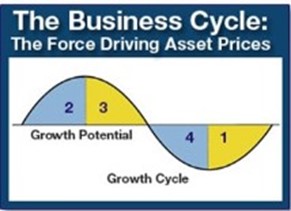
The business cycle goes through four distinctive phases. The trends pointing to the end of Phase 4 are:
- Commodity and inflation are declining.
- Sales growth is lower than the pace of inventory accumulation.
- Income after inflation starts rising.
- Consumer confidence rebounds as consumers respond favorably to the decline of inflation, interest rates, and to the rise of real income.
These favorable developments create the conditions for the business cycle to move into Phase 1. Sales increase because of consumers’ improved financial conditions. Business is forced to boost production to build up inventories to respond to the rising demand. Business will have to hire new people, buy raw materials, and increase borrowing to improve and possibly expand capacity.
These activities place a floor on commodities and interest rates. As the positive feedback continues, improved sales feed into rising inventories, rising employment, and increased borrowing.
This expansion benefits the banking sector, of course, because it provides the liquidity needed to fuel the positive loop thus creating even more growth. This is the time when bank stocks outperform the market.
There is a point, however, when the high level of production places upward pressure on commodities, interest rates, and inflation. The business cycle enters Phase 2, reflecting an even stronger economy.
But rising commodities, interest rates, and inflation eventually have a negative impact on the finances of consumers as it is happening now. Consumer confidence peaks and then declines. Demand for goods slows down.
Business recognizes inventories are now rising too rapidly due to the slower demand and are having a negative impact on earnings. Production is curtailed. Purchases of raw materials are reduced. Hiring is cut. Improvements and expansions of capacity are delayed resulting in lower borrowing, an unwelcome development for banks.
Where are we now?
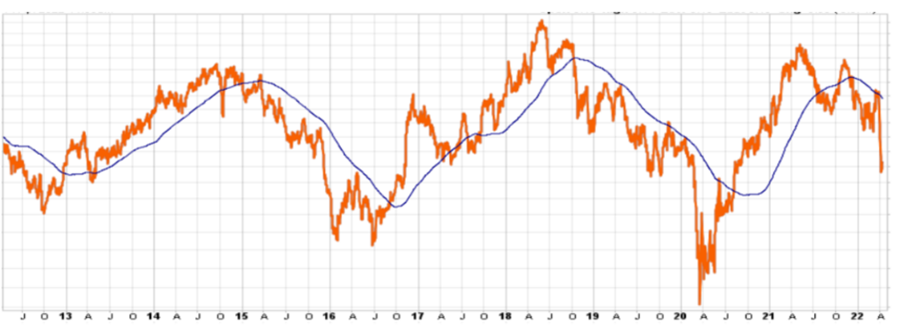
Source: StockCharts.com, The Peter Dag Portfolio Strategy and Management
The above chart shows the business cycle indicator updated in real time from market data and reviewed in each issue of The Peter Dag Portfolio Strategy and Management. It shows the previous two cycles (2011-2014 and 2014-2020) and the current one started in 2020.
This indicator and data about growth in heavy truck sales, in income after inflation, in retail sales after inflation, and the action of the defensive market sectors (see below) confirm the business cycle is now declining, reflecting slower economic growth. The business cycle is now in Phase 3.
The slowdown process will continue until the causes that produced it are brought under control and consumers recognizes their finances are improving. This new environment will be characterized by the decline in inflation and interest rates. This process will take place in Phase 4, the most painful phase for consumers and the financial markets.
During Phase 3 and Phase 4 the sectors outperforming the markets are utilities (XLU), healthcare (XLV), staples (XLP), REITs (XLRE), and long-duration Treasury bonds.
The performance of the various sectors keeps repeating as the business cycle swings from periods of stronger to weaker growth.
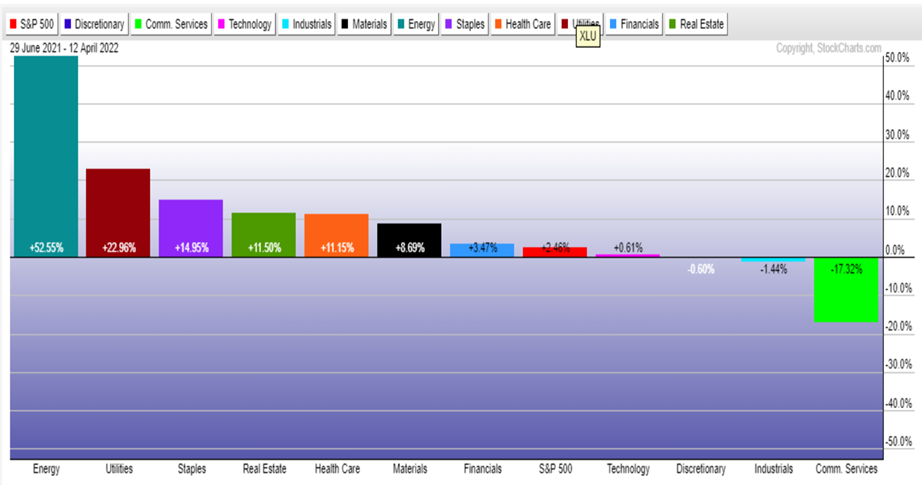
Source: StockCharts.com, The Peter Dag Portfolio Strategy and Management
The sectors outperforming the market over the last two hundred days (except for energy) have been the four sectors mentioned above. Their performance confirms the business cycle is declining, reflecting a weakening economy.
The financial sector, and banks in particular, is a cyclical sector outperforming the market during periods of strengthening business cycle.
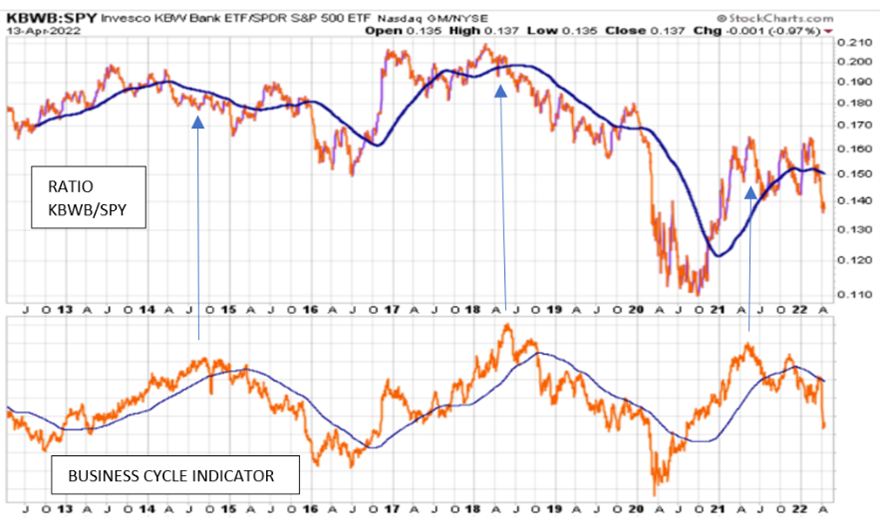
Source: StockCharts.com, The Peter Dag Portfolio Strategy and Management
The above chart shows the ratio of Invesco bank ETF (KBWB) and the S&P 500 ETF (SPY). The ratio rises when bank stocks outperform the market. The ratio declines when bank stocks underperform the market.
The lower panel of the above chart shows the business cycle indicator computed in real-time as reviewed in each issue of The Peter Dag Portfolio Strategy and Management.
The chart shows bank stocks outperform the market (the ratio rises) when the business cycle rises, reflecting a strengthening economy. The ratio declines, reflecting the underperformance of the bank stocks, when the business cycle indicator declines in response to a weakening economy.
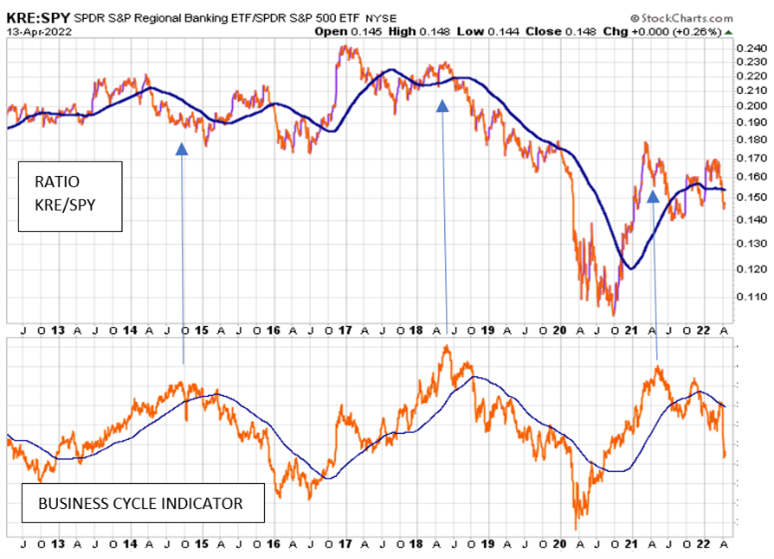
Source: StockCharts.com, The Peter Dag Portfolio Strategy and Management
The above chart shows regional banks stocks (KRE) respond like the major center banks stocks to the changes of the business cycle. They outperform the market when the business cycle indicator rises and underperform the market when the business cycle indicator declines.
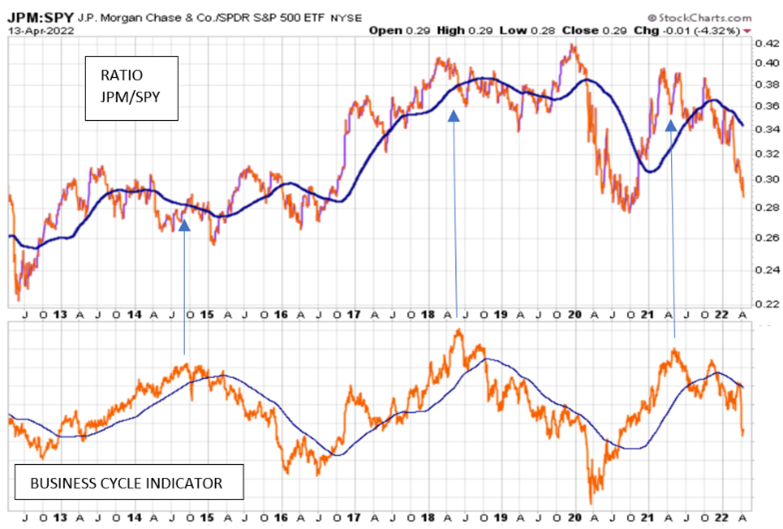
Source: StockCharts.com, The Peter Dag Portfolio Strategy and Management
Even large and well-managed banks like JP Morgan (JPM) are not immune to the changes in the business cycle as shown in the above chart. The stock of JP Morgan outperforms the market when the business cycle rises and underperforms the market when the business cycle declines.
Key takeaways
- Bank stocks respond to changes of the business cycle and not of interest rates.
- Bank stocks outperform the market when the business cycle rises, reflecting a strengthening economy (Phase 1 and Phase 2 of the business cycle).
- There is a point when rising interest rates and inflation cause the business cycle to decline. This is the time when bank stocks start underperforming (Phase 3 and Phase 4 of the business cycle).


