

The S&P 500 (SPX) pierced the -3ATR line on a daily chart again yesterday, and a short-term relief rally from this oversold condition usually occurs at this point, states Ian Murphy of MurphyTrading.com.
These rallies can be powerful and can often drive the index back to the EMA (arrows).
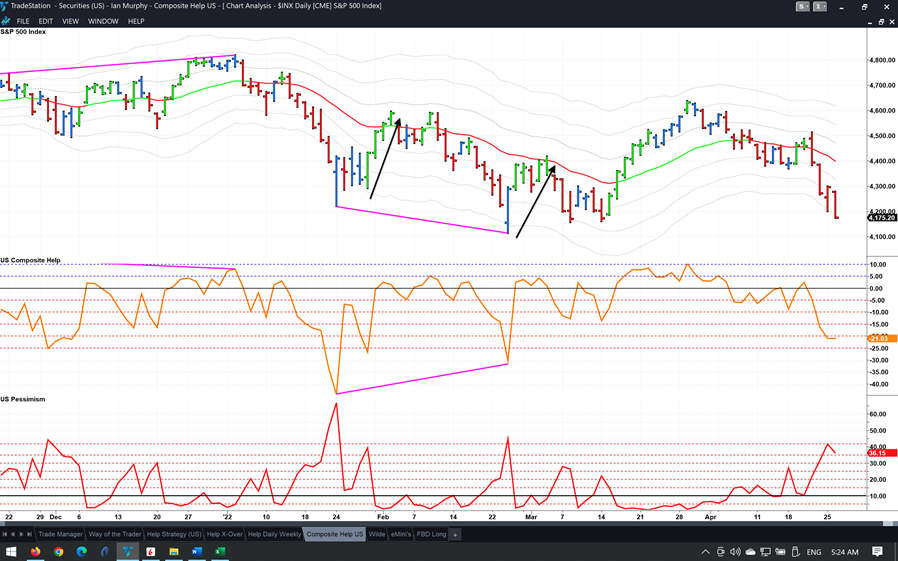
Click charts to enlarge
If a bounce does indeed occur (how long it lasts is another story), but 2217 US stocks made new 20-day lows in yesterday’s session and a few of these are highly likely to offer daily swing trading opportunities in the coming days.
I downloaded the 2217 tickers, filtered out the low liquidity stocks (<$3, <300k), and dropped the remaining 943 tickers into the FBD screener. Now it’s a matter of watching closely for false downside breakout signals to confirm valid trading triggers in this strategy.
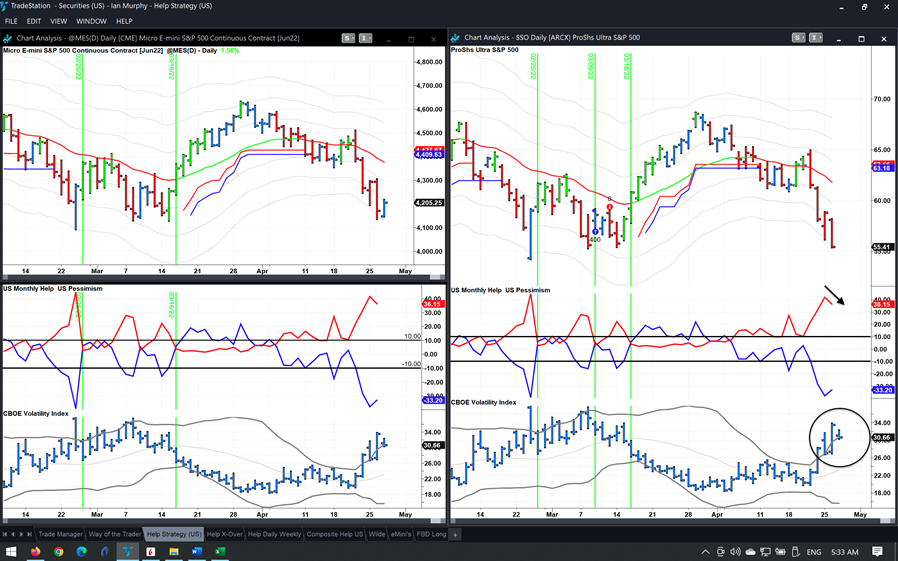
Click charts to enlarge
The Help strategy may also trigger today or tomorrow. CBOE SPX Volatility Index (VIX) is already back below the upper Bollinger Band and the Pessimism and Help indicators have expanded perfectly. If these get back into the channel and the price bar also cooperates, trade is on!
Learn more about Ian Murphy at MurphyTrading.com.


