

Inflationary pressures and subsequent hawkish Federal commentary have led to bloodshed in the bond market, with treasuries posting their worst quarter since 1980, states Garrett DeSimone of OptionMetrics.
The aggressive rise in treasury yields also has a significant impact on real economic activity, as elevated borrowing costs reduce investment.
While rising rates serve as a market cooler, they are not as detrimental to economic growth as the perceived uncertainty surrounding rate increases. Heightened uncertainty around the path of interest rates has substantial consequences on the decisions of all market participants; banks have difficulty pricing lending products, business cashflows and ROI are less predictable, and consumers are less likely to engage in large purchases that require financing.
The research presented here indicates that for every 1% increase in macro uncertainty, new housing starts drop 2% in the next three months. This indicator does not bode strongly for future home construction. A market-based measure of uncertainty is extracted from options on ten-year treasury futures. From a financial perspective, the implied volatility is the forecasted range of treasury futures prices. From an economic perspective, it embeds fear regarding the path of rate hikes, inflation, and growth.
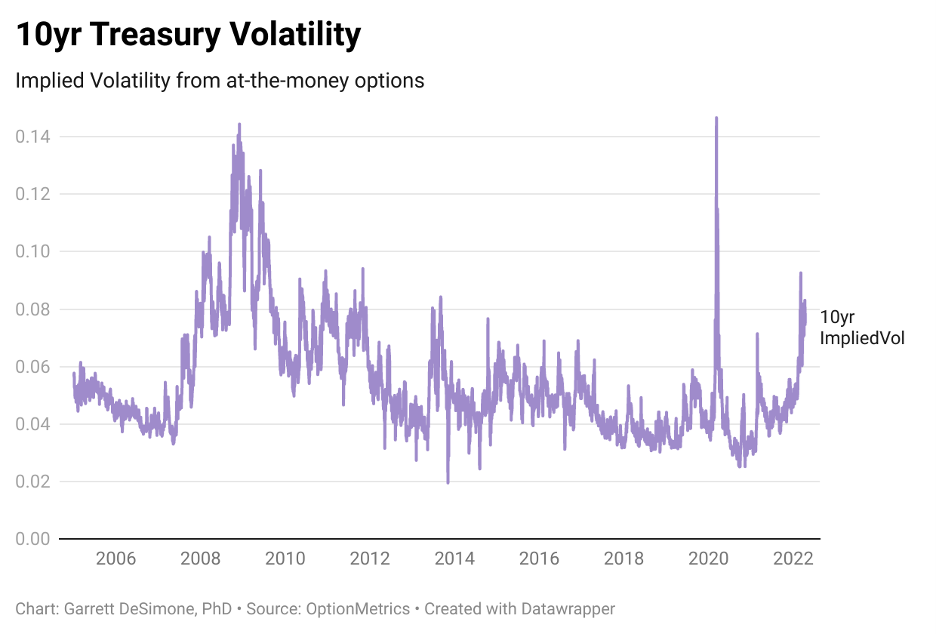
Graph One plots the ten-year treasury volatility of at-the-money options, obtained from the IvyDB Futures Database. Since February, volatility has accelerated to the highest levels since the pandemic. It is important to note that high-yield environments are not always associated with high volatility. For example, between 2005 and 2006, yields were hovering between 4% and 5% with volatility markedly lower than at the current levels.
A valuable indicator of overall economic health is the monthly housing starts data provided by the United States Census Bureau and St. Louis Fed Database. This research focuses on housing starts because it is a leading recession indicator—precipitous declines in starts often lead to slow growth. Intuitively, homebuilders are less likely to break ground on new projects if the economic outlook is bleak or credit conditions are prohibitive. Graph Two plots the housing starts data from Jan 2005 to the present.
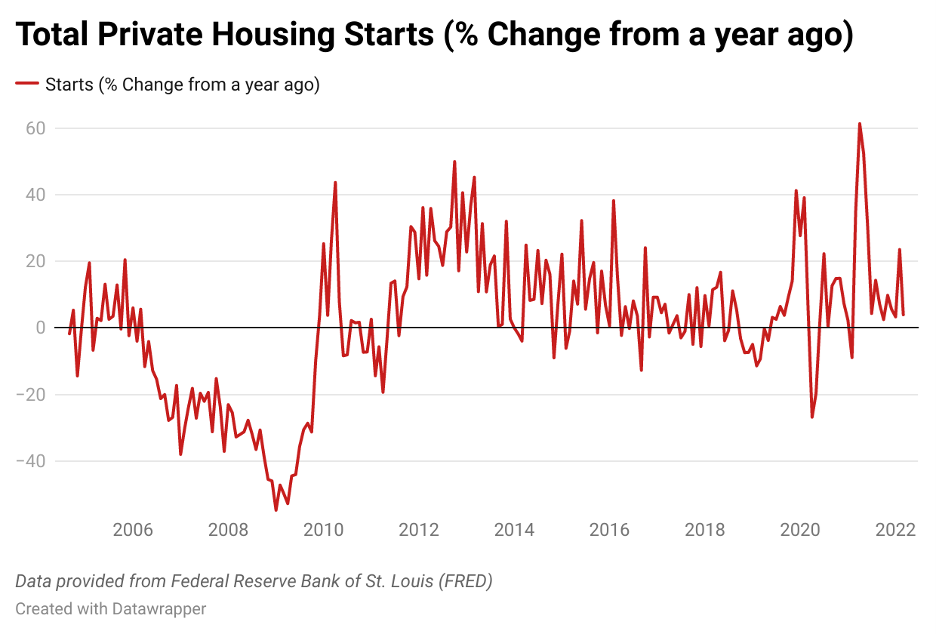
From the above graphs, it is apparent that spikes in treasury vol precede declines in new housing construction. Next, we validate this theory with statistical evidence.
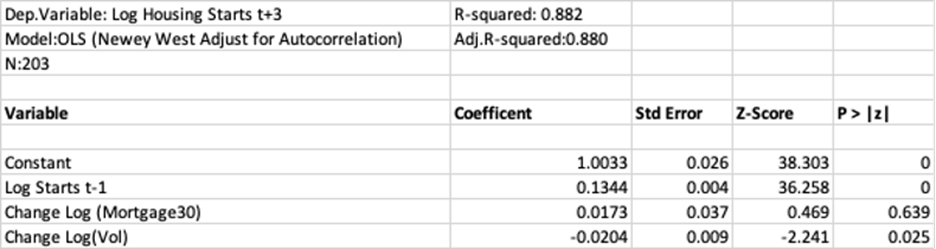
We apply a monthly rolling time-series regression equation, shown below, to study the predictive power of treasury volatility increases on future housing starts. A regression is comprised of a dependent variable (one-quarter ahead log of housing starts) and independent variables (past month's housing starts, last month's change in mortgage rates, and last month's change in treasury volatility). As a technical detail, natural logarithms and differences are applied to enforce well-behaved statistics.
![]()
The table below displays the results. These findings indicate that previous changes in treasury vol are a statistically significant predictor (at a 5% level) of housing starts one quarter in advance. The coefficient on the TreasuryVol term of -0.02 indicates that for every 1% increase in vol, housing starts are expected to decline 2% in the next three-month period. Interestingly, mortgage rates have no significant relationship with housing starts in the presence of treasury vol.
Source: Garrett DeSimone, PhD and OptionMetrics
The current state of the bond market does not signal optimism for the summer home construction season. Current volatility levels are circa 8% which rank in the 90th percentile of observed values since 2005. Elevated levels of economic uncertainty in treasury predict a slowdown in home building, with ominous knock-on effects for the prospects of the broader economy.
Garrett DeSimone, PhD, is Head of Quantitative Research and Abhinav Gupta is a Quantitative Researcher at OptionMetrics, LLC. Their company is an options database and analytics provider for institutional and retail investors and academic researchers that has covered every U.S. strike and expiration option on over 10,000 underlying stocks and indices since 1996. It is online at www.optionmetrics.com.


