

Stocks are very oversold at the moment, which means that some sort of bounce is plausible, States Joe Duarte, editor of In the Money Options.
Still, this market is starting to become a very dangerous place. Relentless selling pressure and suddenly worsening economic data suggest stock traders have decided to pack it in for a while. And that suggests that, whether we like it or not, we may be in a bear market thanks to the Fed targeting MELA.
The problem, of course, is that if the Fed kills the stock market, the economy is likely to follow. And, as I describe below, there are some cautionary signs now popping up in the Texas economy. So, yeah, it’s starting to feel like a bear market.
Fed Misses Point on Inflation
As I noted here last week: “you’re not paranoid if they really are after you.” And in this market, the Fed is out to get investors. That’s because the central bank is fully aware of the fact that the stock market is the major source of income for a large portion of the population—the portion that spends money and makes financial decisions on the state of their trading accounts (crypto included), their IRAs, and their 401 (k) plans.
As a result, the stock market is now the major influence on the economy—the reverse of the past relationships. In other words, it’s now the markets (M), which influence the economy (E), and people’s long-term life decisions (L). And as we’re witnessing, everything happens faster because of artificial intelligence (A), the rapid communications of social media, and the 24-hour news cycle.
Now, here’s where the Fed is making its mistake. This run of inflation is not like the inflation of the 1970s. In that case, inflation resulted from President Nixon’s ending of the gold standard for the US Dollar, which he followed with wage controls. The combination led to stagflation.
This inflation, as I noted here last week, is a structural problem because the MELA crowd has enough money to buy things while, due to Covid, the shutdowns, and now the war in Ukraine, there aren’t enough factories, operating mines, farms, etc. or employed workers in any of these areas to make, transport, or get enough raw materials to fill the demand.
So, while in both the 1970s and in the present, inflation is a monetary phenomenon—too much money chasing too few goods, the underlying causes for the increase in money supply are different. In other words, while raising interest rates was the right move in the 1970s, in this case, it’s not.
And that’s because the only way to fix this inflationary run is to make more products in order to fill the demand.
Meanwhile, as I describe directly below, the housing market continues to be a key cog in the MELA system. And my recent trip to South Texas offers some interesting observations.
Tales from the Road: Empty Lots on I-45 and “Zero Down” Homes Popping Up
A perfect example of how the Fed is flirting with disaster is in the effects of its push to raise interest rates on the housing market. Specifically, rising mortgage rates have hit pending home sales and have also significantly slowed building permits for single-family homes.
This was evident on a recent trip I took to South Texas. As I drove along I-45 getting closer to Galveston, I saw a deep contrast to what I’m seeing in the Dallas (DFW) area. While in DFW there are still new housing developments popping up everywhere, along I-45, many of the same developers are sporting empty fields with little more than model homes and hopeful signs on them.
North of Houston, in Conroe, there are two builders advertising starter homes for “zero down” payment. This is an echo of 2007 and is clearly worrisome. Moreover, I didn’t see anyone hurrying into their lots to take a chance.
In fact, the traffic on I-45 was heavy on the weekend. Sunday was a madhouse, but the ride back on Thursday was sparse by I-45 standards. I made the ride from Galveston to Dallas in about four hours including gas stops and road work delays. The telltale sign that something isn’t quite right might have been the smaller crowds at popular gas station supermart, Bucee’s, on the way back.
This comes even as DR Horton (DHI) recently reported better than expected earnings while raising guidance for 2022. But the true tale of the housing market is inside Horton’s earnings report. Here are the key points:
- Rising demand in the face of limited supply.
- Supply chain problems and labor shortages.
- Extended time to completion.
- Higher selling prices and tighter inventories (only 600 homes available at end of last quarter).
- Slightly higher cancellation rates and a 10% decrease in sales.
Still, despite the quarterly beat, sales are slowing, which is why the company is keeping a very tight lid on inventories. Moreover, here is the key statement from the company: “We are still selling homes later in the construction cycle to better ensure the certainty of the home close date for our home buyers.”
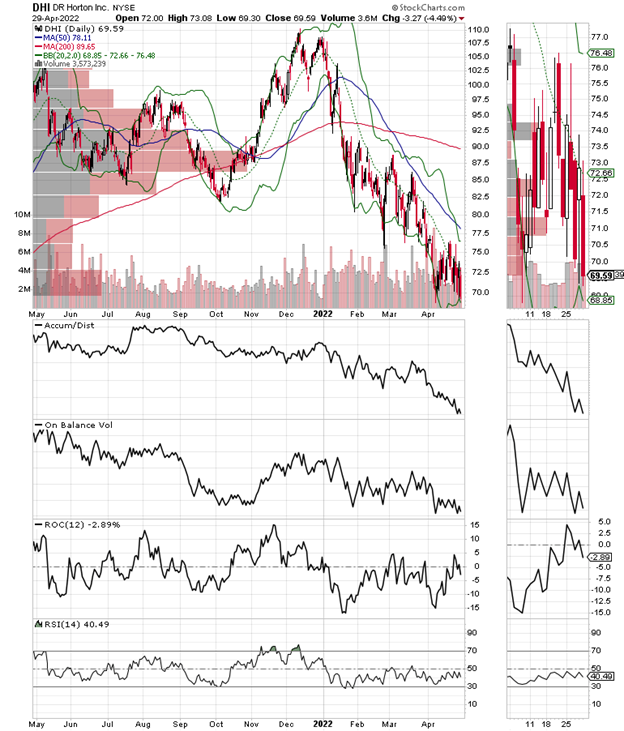
And it’s that final statement that says it all. Horton is still selling houses and making money. But they are not going to be building any more houses than they sell. In addition, the company is more than happy to wait for buyers to come to them and to be fully financed before taking a chance.
Meanwhile, I wonder what’s going to happen in Houston and Conroe where the lots are empty and they’re trying to sell starter homes for “zero down”, and whether that’s a sign of what’s to come for the rest of Texas, whose economy has held up better than that of other areas of the country.
I own shares in DHI.
Options Doom Loop Potential Rises
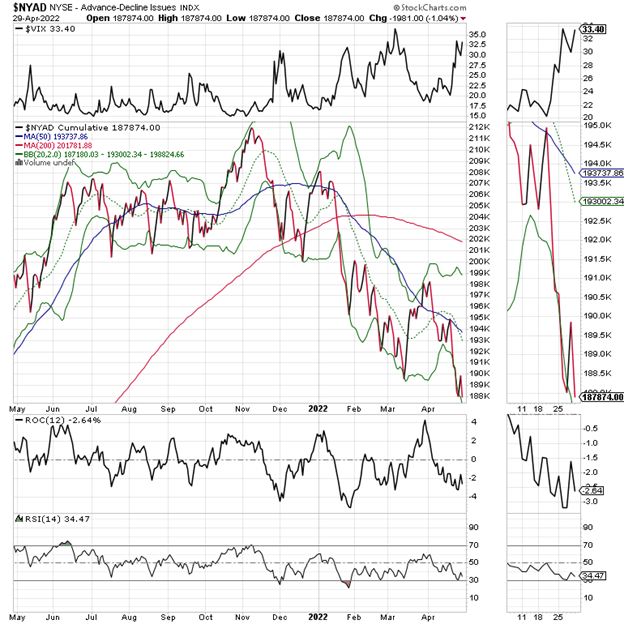
So, the big move that I’ve been expecting finally came, and unfortunately, it was to the downside. Now, the New York Stock Exchange Advance-Decline line (NYAD) is clearly in a bearish trend as are the major indexes.
The S&P 500 (SPX) looks ready to test the 4000-4100 support area, below which there isn’t any major support shelf. SPX is oversold, however, so it is possible that it could stabilize at these levels for a few days. But apart from that, it’s starting to become a very concerning picture.
>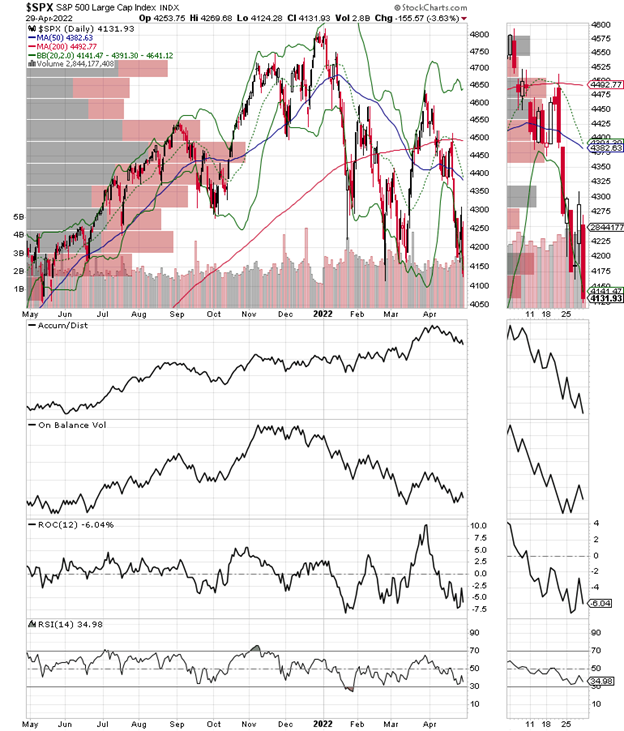
Accumulation Distribution (ADI) says the short sellers are in charge for now while On Balance Volume (OBV) shows more sellers than buyers, a reversal of the pattern evident just a couple of weeks ago.
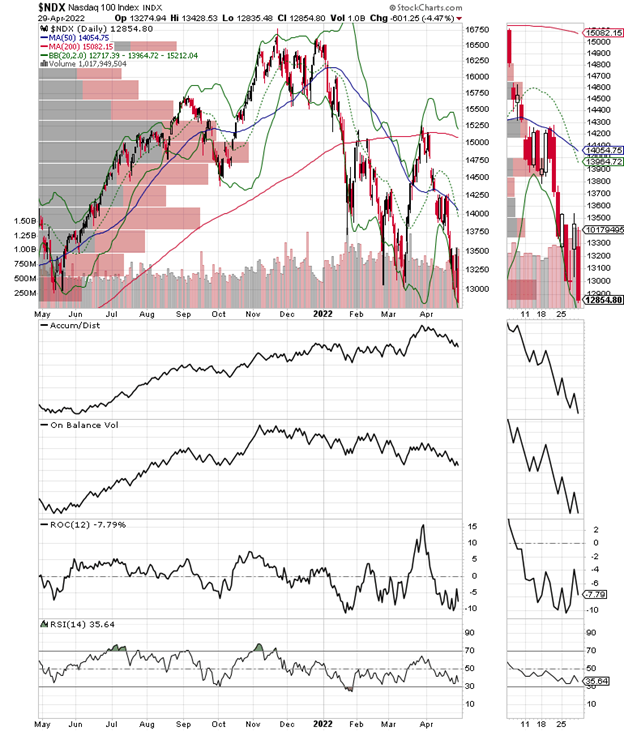
The Nasdaq 100 Index (NDX) shows similar action with support near 13,000. However, the Volume by Price (VBP) bar at 13,000 does not look very stout, so it may not hold.
To learn more about Joe Duarte, please visit JoeDuarteintheMoneyOptions.com.


