

Stocks fell sharply, closing out an ugly April, notes Bonnie Gortler of bonniegortler.com.
For the week, all eleven S&P SPDR sectors were down. Materials (XLB) and Technology (XLK) fell the least, while Real Estate (XLRE) and Consumer Discretionary (XLC) were hit the hardest. The SPDR S&P 500 ETF Trust (SPY) was down -3.30%.
4/22/22 – 4/29/22 S&P SPDR Sector ETFs Performance Summary
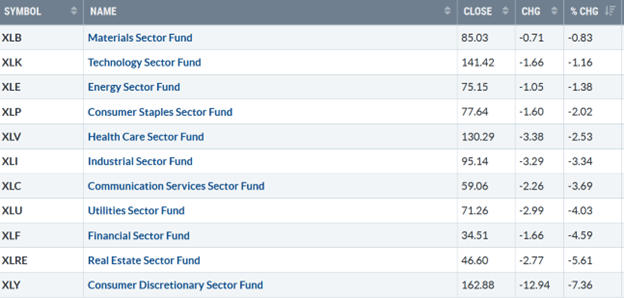
Source: Stockcharts.com
Figure 2: Bonnie's Mix of ETFs Performance Summary 4/22/22 – 4/29/22
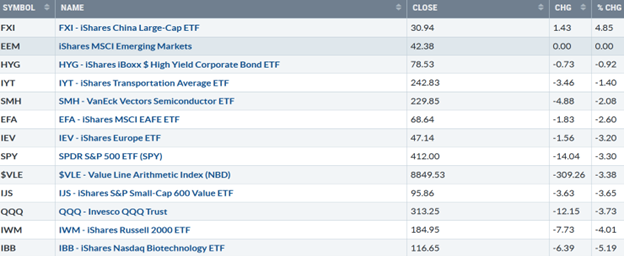
Source: Stockcharts.com
For the second week in a row, China (FXI) was the leading performer, but a continued broad decline for other ETFs I watch closely, with both growth and value lower and most global markets.
Figure 3: April Month Performance Performance Summary 3/31/22 – 4/29/22
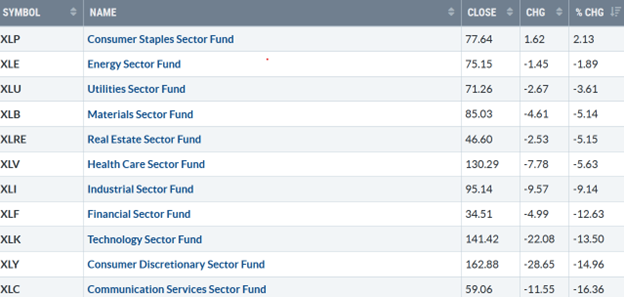
Source: Stockcharts.com
There was no place to hide except Consumer Staples in April; Financials, Technology, Consumer Discretionary, and Communication Services fell more than 10%.
Figure 4: CNBC Fear & Greed Index 4/29/22
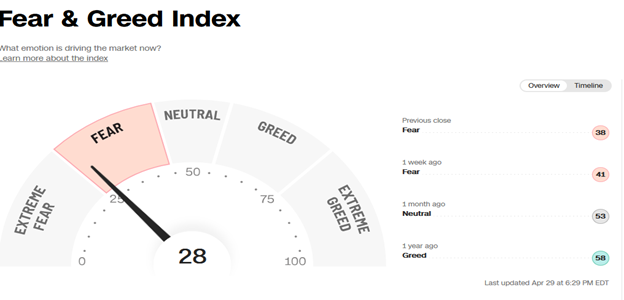
Source cnn.com
Last week, the CNBC Fear and Greed Index (a contrary indicator) closed at 28 in the fear zone, closer to extreme fear, which may or may not occur before the final market bottom.
Figure 5: AAII Investor Sentiment Survey Week Ending 4/27/22
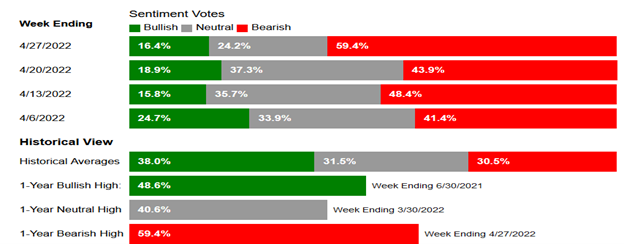
Source aaii.com/sentimentsurvey
AAII Sentiment Survey (a contrary indicator) fell by 2.4% to 16.4%, showing bullish sentiment below 20% for the third consecutive week. Optimism remains below its historical average of 38.0%.
Figure 6: UST 10-Year Bond Yields Daily
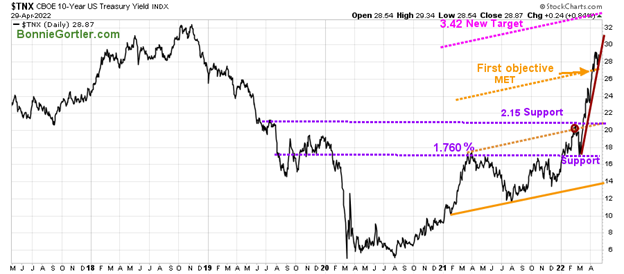
Source: Stockcharts.com
The 10-Year US Treasury Note (TNX) yields dropped last week, closing at 2.887%. The upside target of 3.42% remains. The Five-Year US Treasury yield dropped last week, closing at 2.92% (Figure:7).
Figure 7: UST 5-Year Bond Yields Daily
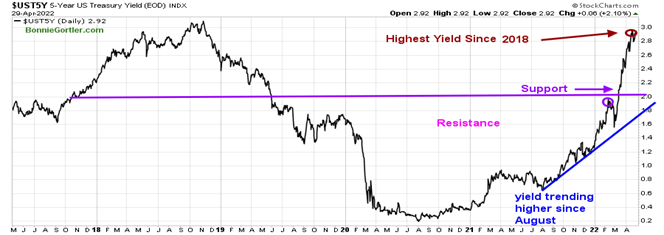
Source: Stockcharts.com
The Dow (DOW) fell -2.47% for the week and -9.25% year to date. The S&P 500 (SPX) was down -3.27% and -13.31% in 2022. Nasdaq (NDX) fell -3.93%, now down 21.16% in 2022. The Russell 2000 Index (RUT) was down -3.95% declining by -16.98% in 2022. The Value Line Arithmetic Index (a mix of approximately 1700 stocks also was under pressure, down -3.38%, -10.8% for the year.
Figure 8: The Value Line Arithmetic Average
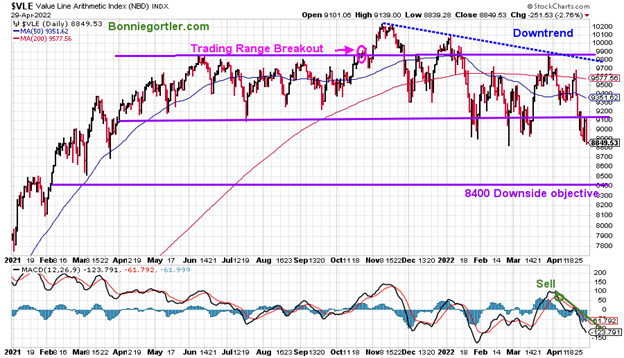
Source: Stockcharts.com
Weekly market breadth remained lousy for the New York Stock Exchange Index (NYSE) and Nasdaq. The NYSE had 950 advances and 2597 declines, with 70 new highs and 989 new lows. There were 1369 advances and 3962 declines on the Nasdaq, with 187 new highs and 1570 new lows. All in all, awful tape readings.
Figure 9: NYSE Cumulative Advance-Decline Line (Top) and NYSE Index (Bottom)
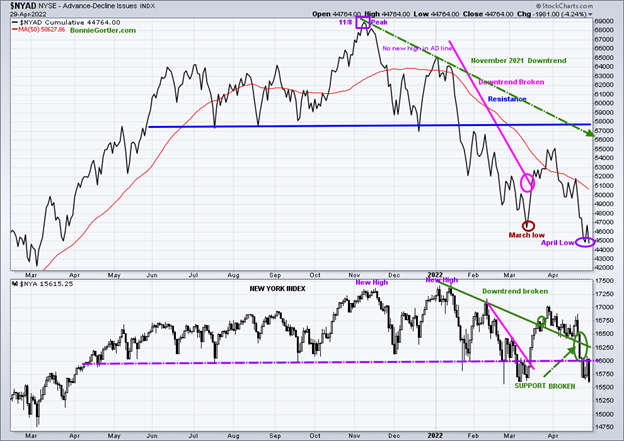
Source: Stockcharts.com
The New York Index made a new high in November 2021 and in January 2022 (bottom chart), unconfirmed by the NYSE AD line, which peaked on 11/8/21 (purple rectangle top chart).
Since last November, the NYSE A/D Line has remained in a downtrend (green dotted line top chart). In March, the AD Line and New York Index broke their short-term downtrends (pink line top and bottom chart). However, breadth weakened in April, failing to get above resistance (blue line top chart), and turned down, making a lower low last week than in March.
For a bottom to occur, improved market breadth is needed. Keep a close eye for several days of more advances than declines, with new lows contracting below 150 for the first sign of a potential upside reversal.
Figure 10: CBOE Volatility Index VIX
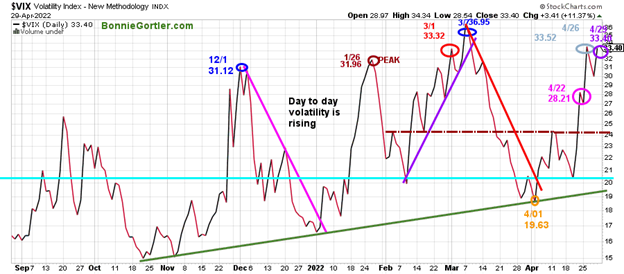
Source: Stockcharts.com
The CBOE Volatility Index (VIX), a measure of fear, has been trading above 20.00 for most of 2022. In January, VIX made a high at 31.96 on 1/26 (brown circle), on 3/1 at 33.32 (red circle), and 36.95 on 3/7 (blue circle).
VIX rose to 33.40, remaining below the peak in March after starting April (orange circle) below 20 at 19.63. Expect more day-to-day volatility until VIX closes at a minimum below 24.00. If you are day trading, adjust your size of trades to be smaller and keep tight stops if the decline continues to accelerate lower to manage risk.
Figure 11: Daily New York Stock Exchange (NYSE) New Lows
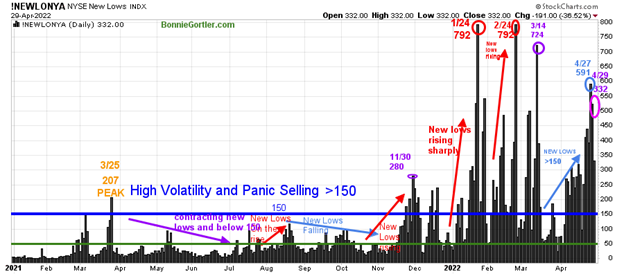
Source: Stockcharts.com
Watching new lows on the New York Stock Exchange is a simple technical tool that helps awareness of the immediate trend's direction.
New lows warned of a potential sharp pullback, high volatility, and "panic selling" for most of 2022, closing above 150. Learn more about the significance of new lows in my book, Journey to Wealth, published on Amazon. Here is an excerpt, "When new lows are above 150, the market is negative, higher risk, and selling is taking place. Sometimes it could be severe, and sometimes on a very nasty day, you can have 'panic selling,' and big wild swings (high volatility) to the downside may occur."
As the market sold off in January, new lows rose sharply, peaking at 792 on 1/24 (red circle), and then contracted but not enough to be in a low-risk zone before rising again on 2/24 at 792, matching the 1/24 peak. In March, things were looking better as new lows fell below 150, and a rally began, but it was short-lived.
Last week new lows closed at 332 on 4/29 (pink circle), less than on 4/27 reading of 591 (blue circle), a positive sign, but remaining above 150, not in a safe zone for the near term. Risk remains of further downside in the near term until new lows contract to below 150 and then fall between 25 and 50.
Figure 12: Daily Nasdaq Advance-Decline Line
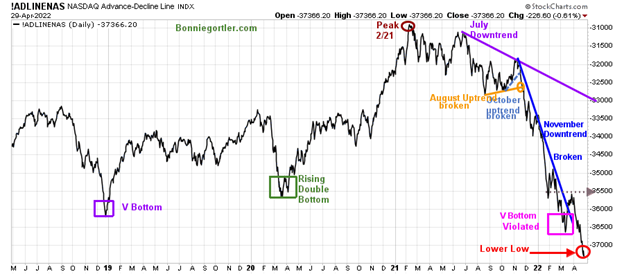
Source: Stockcharts.com
The daily Nasdaq advance-decline line peaked in February 2021 (brown circle), followed by failed attempts to make a new high. After breaking the October uptrend (blue dotted line), the Nasdaq AD-Line made a series of lower highs and lower lows in November, December, and January, and trended down.
The July 2021 downtrend (purple line) remains. After making a lower low (pink rectangle) earlier in the month, a V bottom identical to December 2019 (purple rectangle) formed. The broken downtrend from November (blue) penetrated was a positive sign. However, the AD line turned down with continued negative breadth through April, closing the month at a lower low (red circle).
Figure 13: Daily iShares Russell 2000 (IWM) Price (Top) and 12-26-9 MACD (Middle) and Money Flow (Bottom)
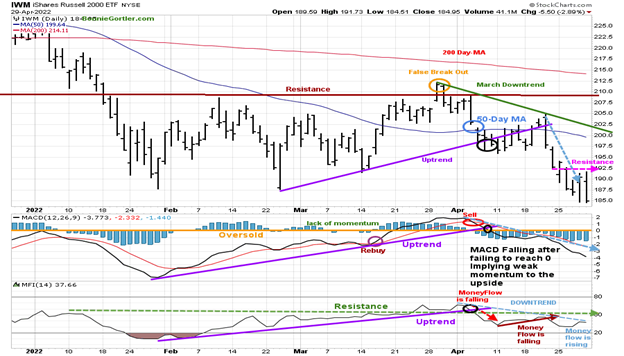
Source: Stockcharts.com
The top portion of the chart is the daily iShares Russell 2000 Index ETF (IWM), the benchmark for small-cap stocks, with a 50-Day Moving Average (MA) (blue line) and 200-Day Moving Average (MA) that traders watch and use to define trends. IWM had the potential to break out to the upside, but in late March, IWM failed to break out above resistance at 210.00 (orange circle) and turned lower, forming a downtrend.
IWM closed below the 50-Day MA (light blue circle), closing at 184.95 under support at 187.00, down -4.01%. IWM is extremely weak, closing at its lowest level since 2021. Short-term resistance is 192.50, 202.50, and 210.00. Support is at 177.00, followed by 170.00.
MACD (middle chart) remains on a sell, below zero, falling as downside momentum increases.
Money Flow (lower chart) turned up and close to breaking the April downtrend.
Note: IWM for the intermediate term (weekly chart not shown) stalled under resistance at 210.00 after generating a buy. However, it continues to be disturbing that the downtrend in MACD remains.
Nasdaq remains weak, continuing its downtrend.
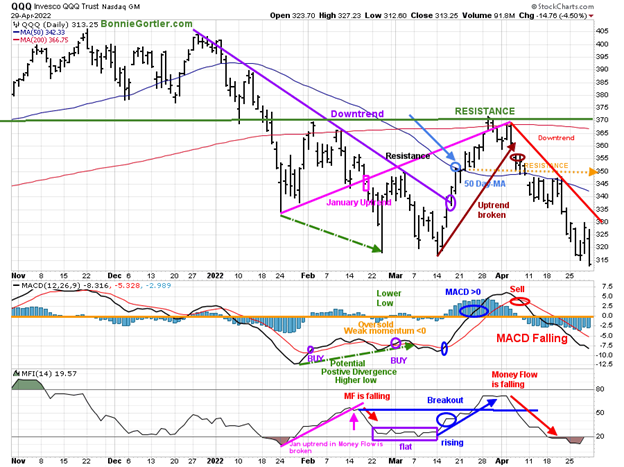
Figure 14: Daily Invesco QQQ Trust (QQQ) Price (Top) and 12-26-9 MACD (Bottom)

Source: Stockcharts.com
The chart shows the daily Invesco QQQ (QQQ), an exchange-traded fund based on the Nasdaq 100 Index with its 50 and 200-Day Moving Average. QQQ accelerated lower after breaking the January uptrend (pink rectangle), penetrating the January lows.
After breaking the March uptrend (brown line) at 355.00, QQQ has been under heavy selling pressure, and the short-term trend remains down (red line).
Last week QQQ fell -by 3.73%, closing at 313.25 and remaining below its 50-Day and 200-Day Moving Average. Resistance is at 335.00 350.00, followed by 370.00. Support is at 310.00.
The middle chart is MACD (12, 26, 9), a measure of momentum remains on a sell and falling.
Money Flow (lower chart) continues lower in April, now oversold and in an area where short-term rallies begin.
Figure 15: Van Eck Semiconductors (SMH) Daily Price (Top), 12-26-9 MACD (Middle), and Money Flow (Bottom)
Stockcharts.com
In late January, Van Eck Semiconductors (SMH) support was broken (red circle) and then fell sharply but held the October 2021 lows. SMH then rallied but turned down again, closing below support at 240.00 on 3/14/22, a false breakdown.
SMH broke the March uptrend (red line) after failing to get above resistance and remains out of favor, down for the fifth week in a row, down -2.08% at 229.85. The next support is at 220.00. Resistance is 245.00, followed by 255.00.
MACD (middle chart) remains on a sell (red circle) and falling.
Money Flow (lower chart) has been trending sideways since April 11. Watch for Money Flow turning higher and continuing to show relative strength compared to the QQQ, which has begun.
Until MACD at least turns up, it remains risky to bottom fish.
Figure 16: I Shares Hi-Yield Corporate Bond (HYG) (Top), and 12-26-9 MACD (Bottom)
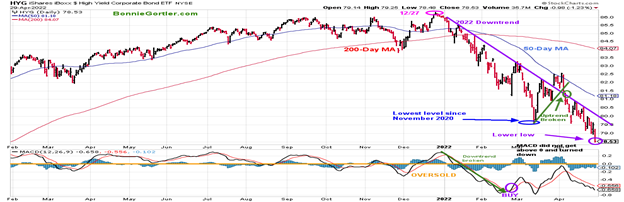
Source: Stockcharts.com
Hi-Yield Bonds (HYG) peaked on 12/27/21, appearing to stabilize in late February but reversed lower in March, reaching their lowest level since November 2020 (blue circle).
HYG continues not to show much strength after breaking the downtrend in early April, a false breakout. HYG remains below its 50-Day MA and closed at a new low for 2022 at 78.53, -1.40% for the week.
MACD did not get above zero and turned down, implying weak momentum. More base building is needed. Monitor the performance of HYG. Until HYG shows strength closing above 80.50 and then 81.10, HYG is likely to trend lower.
Figure 17: Lord Abbett High Yield (LAHYX)
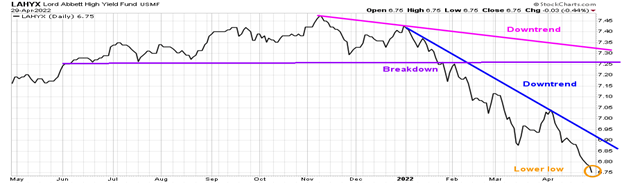
Source: Stockcharts.com
Lord Abbett High Yield (LAHYX), an open-end mutual fund, continues to make lower lows. Monitor the action in Hi-Yield bonds as a clue as to when US equities will begin to stabilize. Continued selling pressure in the financial sector.
Figure 18: Financial Select SPDR (XLF) (Top) and 12-26-9 MACD (Bottom)
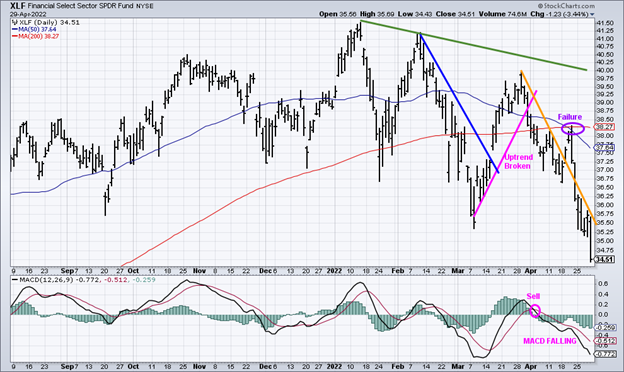
Source: Stockcharts.com
The 2022 short-term downtrend in Financials (XLF) remains.
After breaking its March uptrend (pink line), XLF moved lower, followed by XLF breaking its March downtrend that failed at its 50 and 200-Day MA (purple circle). Financials (XLF) fell by -4.59% last week. MACD remains on a sell, below zero, and falling. Until XLF trades above 36.25 and MACD turns up, the risk remains of further downside.
Figure 19: Weekly Financial Select Sector SPDR (XLF) Price (Top), Financial /S&P 500 (XLF/SPY) Relative Strength Ratio (Middle), and 12-26-9 MACD (Bottom)
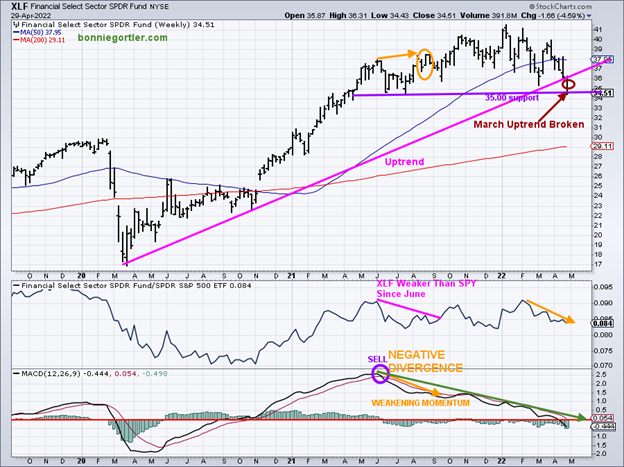
Source: Stockcharts.com
The technical action in Financials remains worrisome, breaking the March uptrend (top chart) last week. In the middle chart, the Financial Sector (XLF) has remained in a downtrend weaker than the S&P 500 since February. Notice how MACD momentum continues to weaken in the lower chart. Once the leader of the advance, finance has lost its luster despite the trend of rising interest rates.
Summing Up:
April, one of the best performing months historically, became the worst month for stocks in 2022. The Nasdaq 100 fell 13% in April, the biggest monthly drop since 2008. The short-term trend remains down, with momentum patterns oversold but not yet favorable. Be alert to a possible short-term bounce early in the week, but more time is needed for downside momentum to slow and a safer buying opportunity for a sustainable rally. The bears remain clearly in control until proven otherwise.
Remember to manage your risk, and your wealth will grow.
I would love to hear from you. If you have any questions or comments or would like to talk about the market, email me at Bonnie@Bonniegortler.com.
Disclaimer: Although the information is made with a sincere effort for accuracy, it is not guaranteed that the information provided is a statement of fact. Nor can we guarantee the results of following any of the recommendations made herein. Readers are encouraged to meet with their own advisors to consider the suitability of investments for their own particular situations and for determination of their own risk levels. Past performance does not guarantee any future results.


