

The team at All Star Charts lately has been talking about how a lot of stocks are displaying declining moving averages and share prices continue to trade below these downward-sloping moving averages, states Sean McLaughlin of AllStarCharts.com.
There is nothing bullish about that.
What it means is there is likely an avalanche of overhead supply in most areas of the stock market right now and therefore many rallies will be met with more and more people trying to unload their positions. This is a tough environment to be a bull in.
There is always money to be made in bear markets, but it requires a different skillset, steel nerves, and quick decisions. And whereas in bull markets, we love to put on bullish positions that have six to nine months to play out so that we can let the underlying trends grind their way higher, in bear markets we like to take more shorter-termed positions because we need to take profits quicker. Bear market rallies are notorious for stopping out even the best of short positions.
With all this in mind, today’s trade is in one of those names that have been in a persistent downtrend and is trading below significant moving averages.
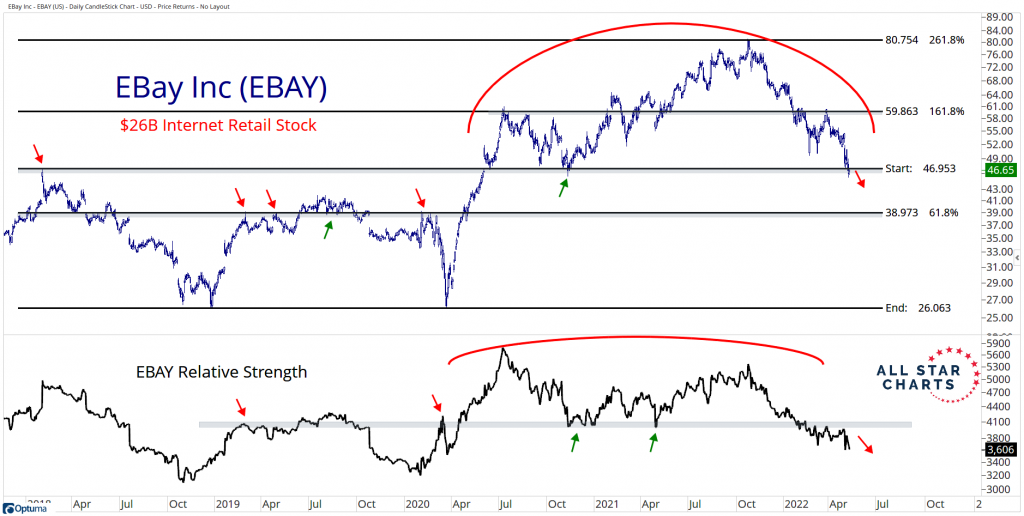
Here’s eBay (EBAY):
Here’s what the ASC team had to say about it in a recent Under the Hood report:
"EBAY made an all-time high only six months ago and looked strong for another leg higher. But, after failing to make a decisive upside resolution, the stock sold off aggressively and is currently making fresh 52-week lows."
"EBAY has already resolved lower from a distribution pattern on a relative basis as it presses toward its lowest level since early 2020 versus the overall market. This breakdown in the relative trend could indicate where the price is headed on absolute terms."
"We want to be short EBAY on weakness below 47 with a target of 39 over the next one to three months."
Not only is $EBAY losing a significant level of support, but its relative strength is always plumbing multi-year levels.
We’re making the bet that this trend will continue.
Here’s the Play
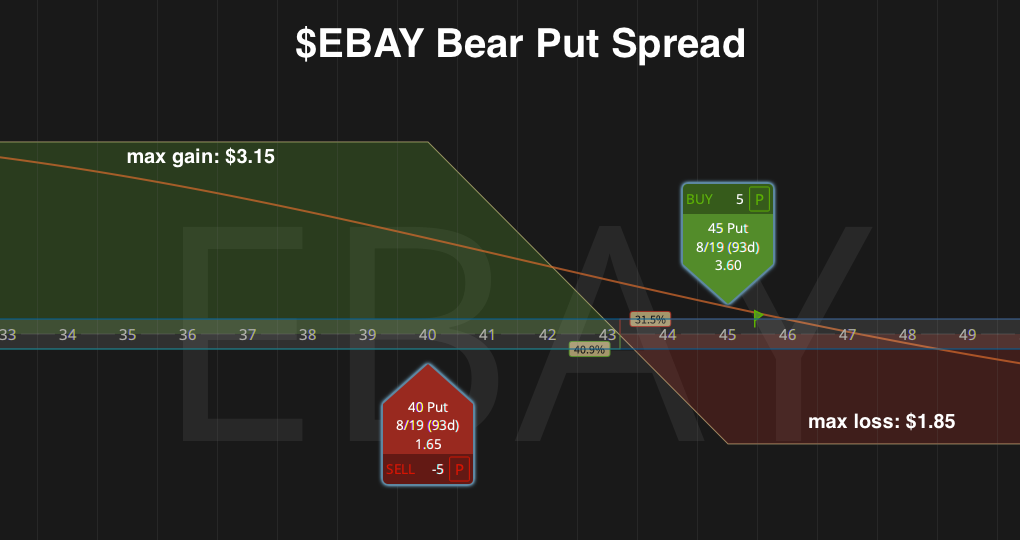
We like an $EBAY August 45/40 Bear Put Spread for an approximately $1.85 debit. This means we’ll be long the 45 puts and short an equal amount of 40 puts and our risk is defined by the net debit we pay to put this trade on.
If we see $EBAY bounce higher from here and close above $50 per share, that will be our signal that we’re likely wrong and we’ll look to exit the trade for whatever we can salvage.
If $EBAY follows through to the downside, we’ll look to exit for a profit in one of two ways:
- We’ll leave a resting GTC order to sell this spread for a profit at $3.45. This would present a capture of 50% of the maximum potential profit in this trade without having to hold the position all the way to August expiration. Or,
- If $EBAY shares hit the ASC team’s $39 price target and we still haven’t hit our GTC order above, then we’ll just close the trade down here for whatever profit we can get. I don’t want to get caught in a wicked bear market reversal that is so prevalent in these types of markets.
Learn more about Sean at AllStarCharts.com.


