The concept of negative dealer gamma has gained notoriety as the grim reaper of returns in index equity markets, states Garrett DeSimone of OptionMetrics.
This anxiety about negative dealer gamma originates from studying dealer hedging behavior; negative gamma exposure (GEX) necessitates persistent selling in falling markets to maintain delta neutrality. Conversely, positive gamma inventory has the reputation of being a smooth tide in markets, gently bobbing returns upwards.
Negative gamma generalizes an environment where dealers are net short options. However, the GEX measurement itself makes no distinction whether inventory is primarily comprised of short puts or short calls. A positive gamma number in isolation suffers from the same implication; dealers are net-long options without detail regarding whether the book is primarily long calls or long puts.
To gain greater insights into gamma hedging and greek exposures and what they might indicate, we leverage a new measure, called Demand for Option Order Delta (or DOOD). DOOD is a measure of excess demand imbalance for delta by end-users of options.
DOOD utilizes buy and sell volume orders to indicate the net imbalance of delta scaled by stock volume on a trading day. It is calculated as the aggregate sum of delta multiplied by net signed option trades scaled by daily stock volume. Positive DOOD indicates higher dealer imbalance for positive delta (long calls/short puts) and negative DOOD signals a greater imbalance for negative delta (short calls/long put). Dealer DOOD assumes dealers are liquidity providers, buying at the bid and selling at the ask.
The full methodology, and more details, on Demand for Option Order Delta are contained in this whitepaper.
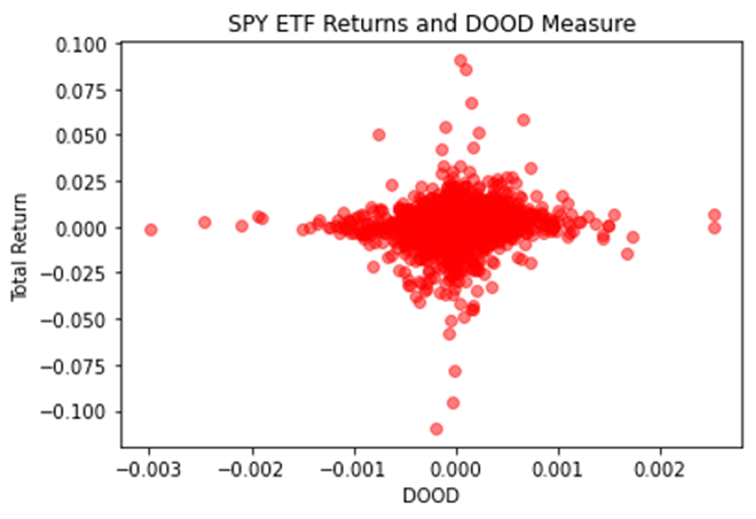
The chart below plots the relationship between DOOD and SPDR SPY Returns.

Source: OptionMetrics
The combination of GEX and DOOD allows us to classify four different market maker environments:
- Positive GEX and Negative DOOD—Dealers are long puts.
- Negative GEX and Positive DOOD—Dealers are short puts.
- Negative GEX and Negative DOOD—Dealers are short calls.
- Positive GEX and Positive DOOD—Dealers are long calls.

Source: OptionMetrics
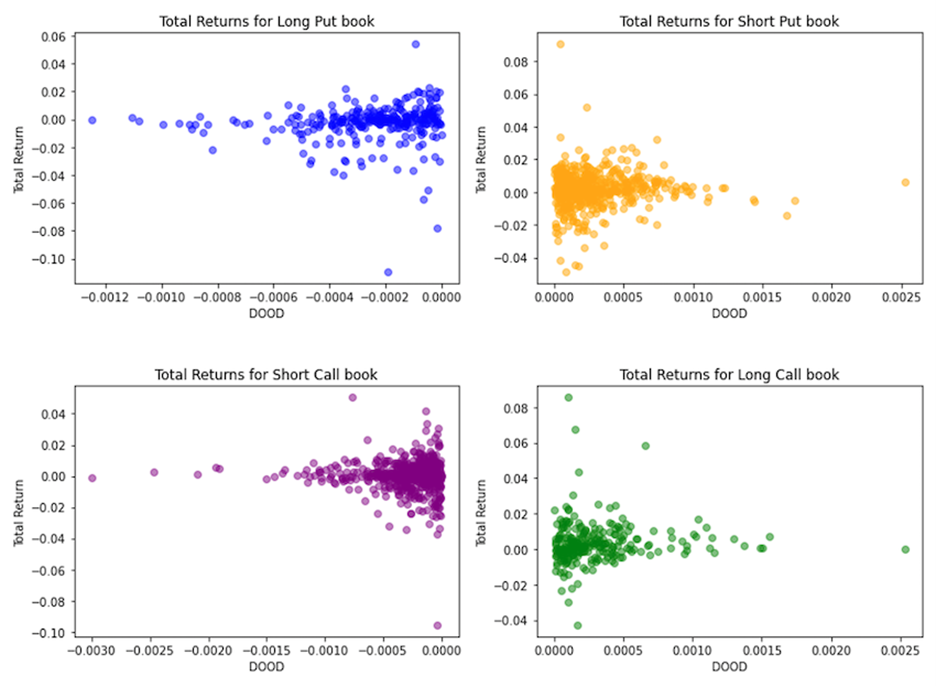
The numbered charts below display the relationship between total same-day returns on SPY and DOOD for each market maker environment. “Short-Calls” days (listed in Table One) are associated with bull market days, whereas “Long Puts” days coincide with those that are bear market days.
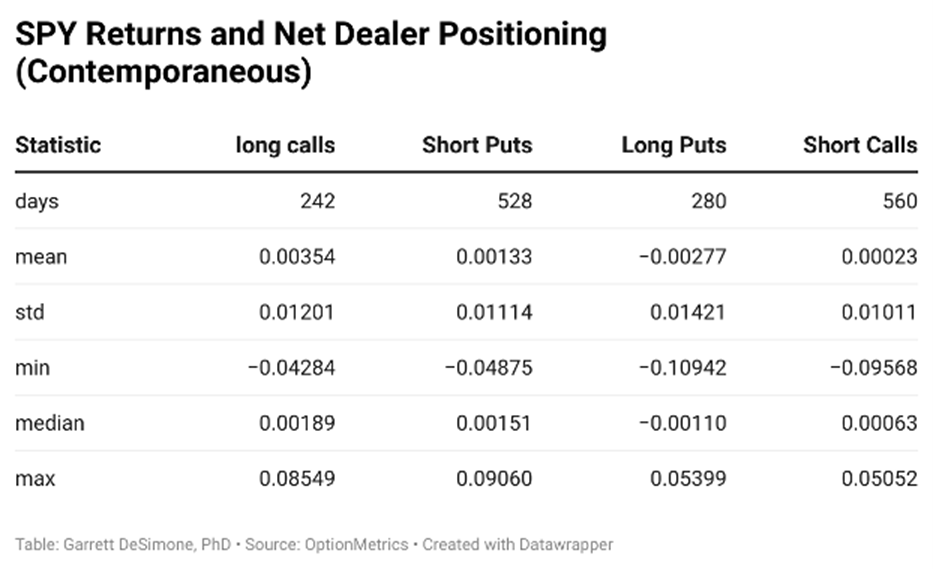
Based on the findings below, the Long-Put Book has the highest standard deviation of daily returns, even though it is “supposed” to be under the balmy positive GEX state. The Short-Call Book has returns in the tightest range (low daily volatility) even though it resides under the turbulent negative GEX state.
Summary statistics are provided in Table One below to verify the graphs.

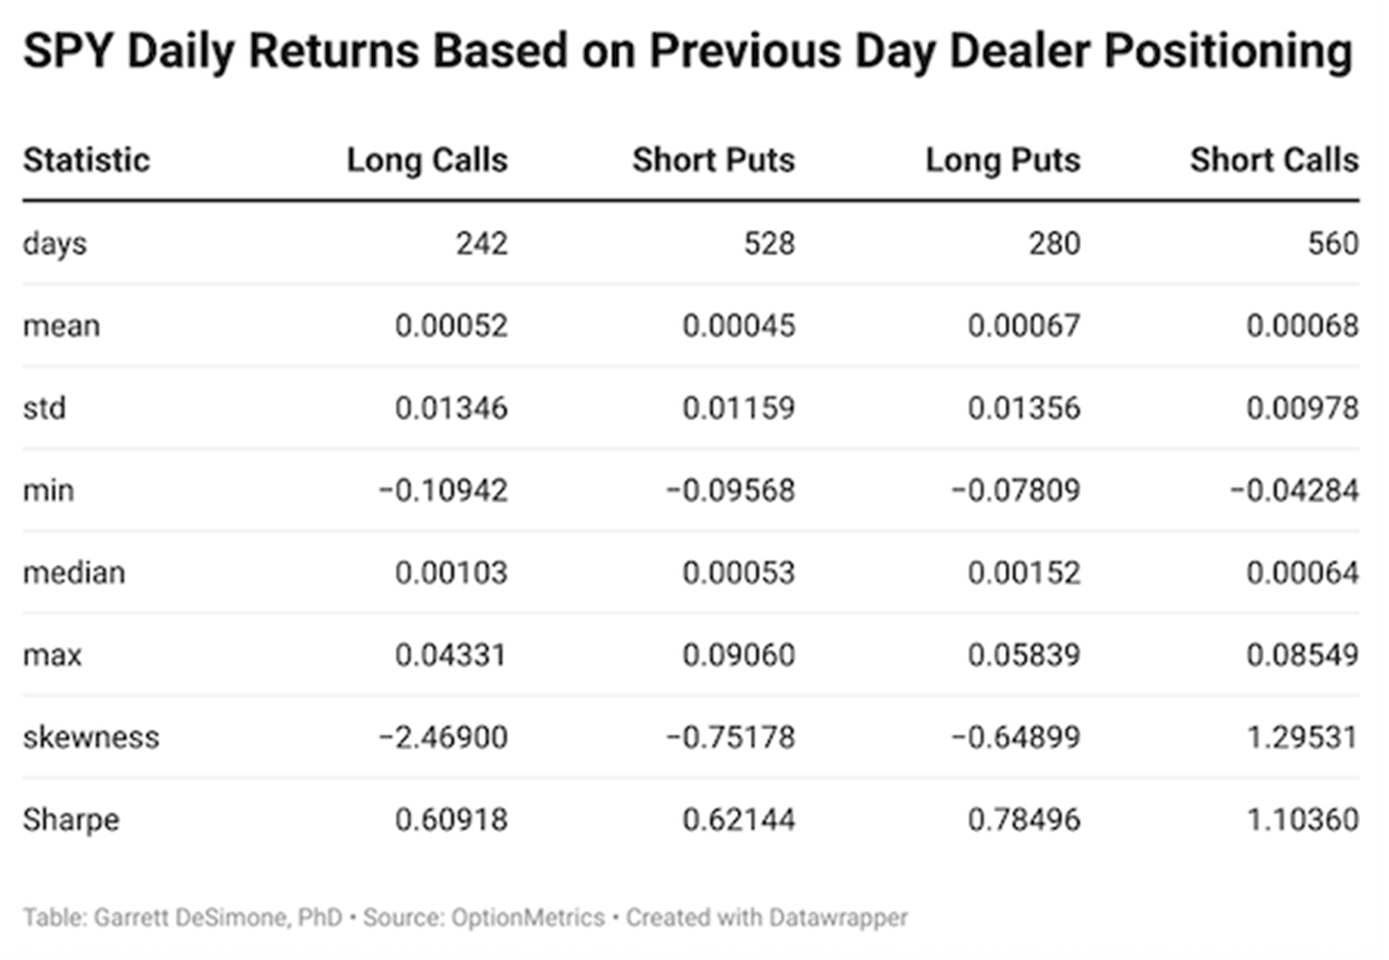
A more substantial discovery is the relationship between each environment (Long Calls, Short Puts, Long Puts, etc.) and the following trading day returns. Table Two documents summary statistics for next-day SPY returns classified by environment. Mean returns are located in row two and volatility is located in row three.

Surprisingly, the short call regime posts the highest returns, along with the lowest volatility. The short call market displays the highest approximate Sharpe, providing the strongest risk-return tradeoff. This finding runs against the traditional GEX theory—that short calls are short gamma which should imply greater volatility compared to other environments.
In contrast, the weakest risk-adjusted performing dealer profile is long calls. It has the lowest approximate Sharpe and significant negative skewness. Under the positive GEX framework, long call environments should be periods of lower volatility.
These findings indicate that gamma exposure alone does not adequately explain realized volatility and return in the S&P 500 ETF Trust (SPY). An important step is the classification of the dealer environment by long versus short call and put exposure. Analyzing returns in this manner provides a new perspective of equity behavior against the traditional understanding of dealer gamma hedging.
Garrett DeSimone, PhD, is Head of Quantitative Research at OptionMetrics, LLC. His company is an options database and analytics provider for institutional and retail investors and academic researchers that has covered every US strike and expiration option on over 10,000 underlying stocks and indices since 1996.


