

Stocks rebounded; ten of eleven S&P SPDR sectors were higher last week, notes Bonnie Gortler of bonniegortler.com.
Consumer Discretionary (XLY) and Health Care (XLV) were the strongest sectors, while Materials (XLB) and Energy (XLE) were the weakest.
The SPDR S&P 500 ETF Trust (SPY) rose by +6.62%.
S&P SPDR Sector ETFs Performance Summary 6/17/22–6/24/22
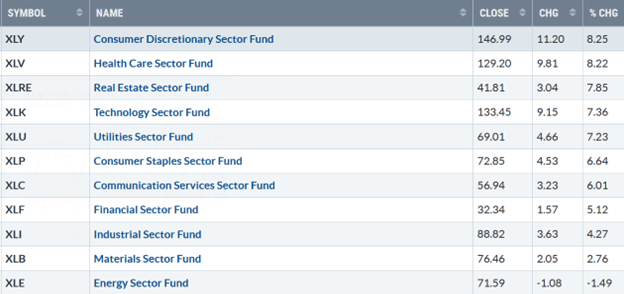
Source: Stockcharts.com
Figure 2: Bonnie's Mix of ETFs Performance Summary 6/17/22–6/24/22
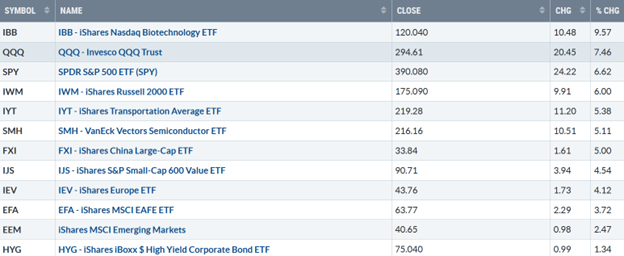
Source: Stockcharts.com
The bears went into hiding. Investors bought stocks aggressively and were willing to take on risks. Biotechnology, Technology, and Small Cap Growth led the market higher. China led the international market higher, continuing its winning ways.
Figure 3: UST 10YR Bond Yields Daily
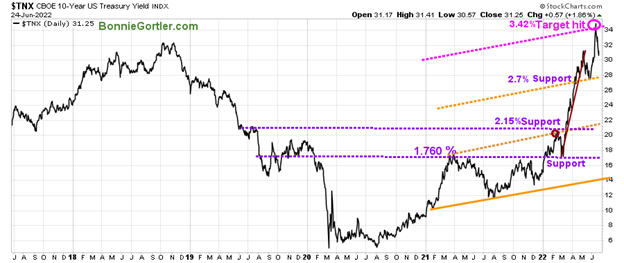
Source: Stockcharts.com
The Ten-Year US Treasury yields moved lower, closing at 3.125%, fueling buying in equities after hitting the upside target of 3.42% the previous week.
Figure 4: UST 5YR Bond Yields Daily
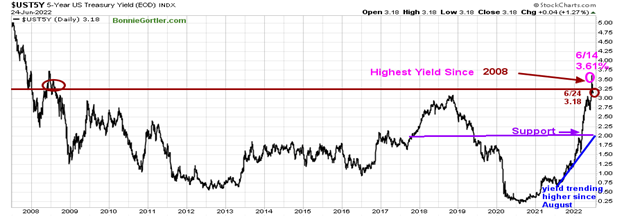
Source: Stockcharts.com
The 5 Year US Treasury yield fell last week, closing at 3.18%, after hitting the highest yield since 2008 the previous week.
The Dow (DJI) rose +5.39%, S&P 500 (SPX) was up +6.45%, the Nasdaq (NDX) rose +7.49%, The Russell 2000 Index (^RUT) rose +6.01%, while The Value Line Arithmetic Index (a mix of approximately 1700 stocks) was higher by +5.64%.
Weekly market breadth was positive for the New York Stock Exchange Index (NYSE) and Nasdaq. The NYSE had 2646 advances and 847 declines, with 38 new highs and 560 new lows. There were 3583 advances and 1623 declines on the Nasdaq, with 113 new highs and 692 new lows.
Figure 5: Nasdaq Advance-Decline Line (Daily)
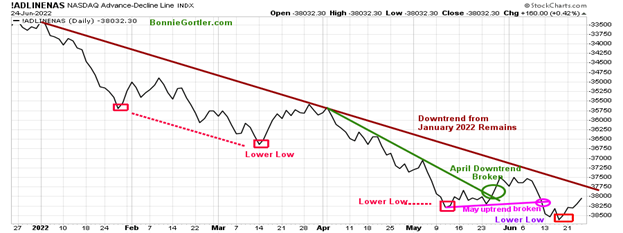
Source: Stockcharts.com
The improvement in breadth at the end of May and early June after breaking its April downtrend didn’t last for long,
Last week market breadth improved as stocks bounced from being deeply oversold. For a sustainable rally that will last for the intermediate-term (weeks to months), continued improvement in market breadth is necessary, including breaking above the January downtrend (brown line).
Figure 6: Nasdaq Advance-Decline Line (Weekly)
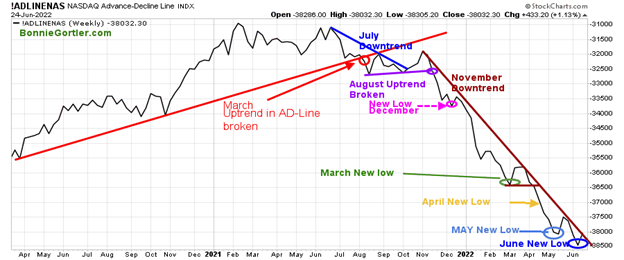
Source: Stockcharts.com
Weekly market breadth turned up after making a new low in June but remains in its downtrend from November 2021.
Figure 7: CBOE Volatility Index VIX
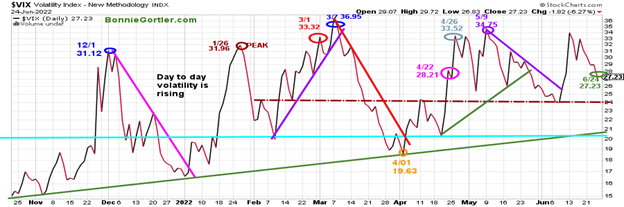
Source: Stockcharts.com
The CBOE Volatility Index (VIX), a measure of fear, has been trading above 20.00 for most of 2022. In January, VIX made a high at 31.96 on 1/26 (brown circle), on 3/1 at 33.32 (red circle), and peaked at 36.95 on 3/7 (blue circle). VIX, through the sell-off, remained below the March peak.
VIX fell last week, closing at 27.23 (green circle), with fear decreasing as the decline stopped accelerating and the market rallied. We have yet to see panic where VIX rises above 40.00 or even 60.00, as seen in the past bear market bottoms.
VIX remains high; therefore, day-to-day volatility could include 2-3% swings on the major averages at any time. On the other hand, if VIX closes below 24.00, intraday volatility is likely to fall, testing the 4/01 April low (orange circle) at 19.63.
Building wealth starts by managing your risk. The first step is a clear investment plan. Start by developing good trading habits. Then, create a disciplined process to trade with the trend and not fight against the trend, increasing your probability of being consistently profitable. ~Bonnie Gortler
Figure 8: Daily New York Stock Exchange (NYSE) New Lows
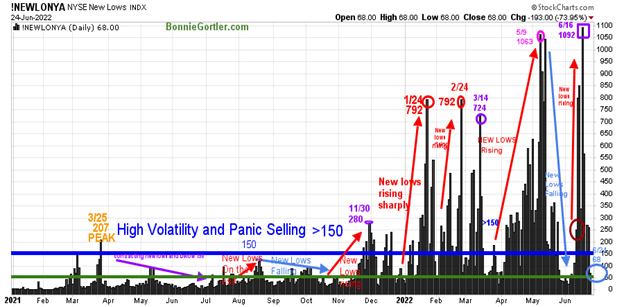
Source: Stockcharts.com
Watching new lows on the New York Stock Exchange is a simple technical tool that helps awareness of the immediate trend's direction.
New lows warned of a potential sharp pullback, high volatility, and "panic selling" for most of 2022, closing above 150. As the market started to move lower in January 2022, new lows rose sharply, peaking at 792 on 1/24 and again on 2/24 (red circles), implying an increased risk of further selling pressure.
Investors in early May unloaded stocks, and new lows expanded to 1063 on 5/9 (pink circle), then on 6/16 (purple rectangle), new lows made a new high of 1092.
Learn more about the significance of new lows in my book, Journey to Wealth, published on Amazon. Here is an excerpt, "when new lows are above 150, the market is negative, higher risk, and selling is taking place. Sometimes it could be severe, and sometimes on a very nasty day, you can have 'panic selling,' and big wild swings (high volatility) to the downside may occur."
New lows fell sharply last week, closing at 68 on 6/24 (light blue circle). New lows are no longer in a high-risk zone. It would be encouraging if news lows fall between 25 and 50, indicating lower risk and a sign that the rally is sustainable in the short term.
On the other hand, it would not be favorable for new lows to rise above 150, then I would expect the rally to stall.
Figure 9: Daily iShares Russell 2000 (IWM) Price (Top) and 12-26-9 MACD (Middle) and Money Flow (Bottom)
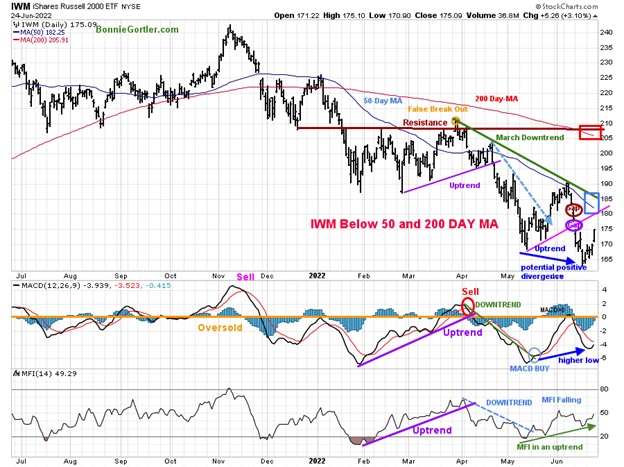
Source: Stockcharts.com
The top portion of the chart is the daily iShares Russell 2000 Index ETF (IWM), the benchmark for small-cap stocks, with a 50-Day Moving Average (MA) (blue line) and 200-Day Moving Average (MA) that traders watch and use to define trends. At the end of March, IWM failed to break out above resistance at 210.00 (orange circle), forming a downtrend (green line).
After IWM fell below support at 183.00, selling accelerated in June, making a new low. Selling subsided as the bulls decided to come out of hiding last week. IWM closed at 175.09, up +6.00%. However, IWM remains below the 50 and 200-Day Moving Averages (blue and red rectangle), which is still falling.
Short-term resistance is 180.00 and 183.00. Support is at 170.00. Sell stops likely sit below the lows on 6/16 of 162.78, which could fuel more selling and another leg down.
MACD (middle chart) remains on a sell below zero and rising, now close to generating a buy with a clear positive divergence. For more on MACD divergences, email me at Bonnie@BonnieGortler.com, and I will send you my article MACD Made Simple.
Money Flow (lower chart) broke the April downtrend (dotted blue line) but stalled, but it’s now rising, a plus.
Weekly Chart Update
It’s positive that IWM stabilized early in the week and closed above key support of 173.00 on 6/24 above its 200-Week Moving Average, which was violated the previous week, avoiding significant downside projections. However, there is no buy on weekly MACD or break of the MACD downtrend.
Time will tell if investors are ready to take on more risk and the bottom has been made.
Figure 10: Daily Invesco QQQ Trust (QQQ) Price (Top) and 12-26-9 MACD (Middle) and Money Flow (Bottom)
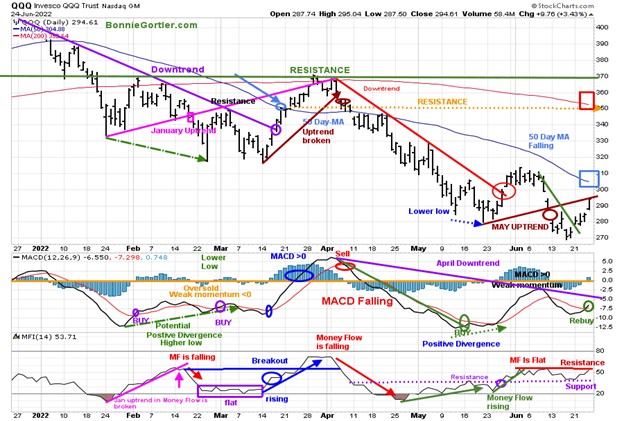
Source: Stockcharts.com
The chart shows the daily Invesco QQQ (QQQ), an exchange-traded fund based on the Nasdaq 100 Index with its 50 and 200-Day Moving Average. QQQ accelerated lower after breaking the January uptrend (pink rectangle), penetrating the January lows. After breaking the March uptrend (brown line) at 355.00, QQQ declined sharply.
At the end of May, the short-term trend turned up after breaking the April downtrend (red line), unable to penetrate the 50 Day MA stalling at 315.00 resistance.
QQQ, one of the strongest sectors for the week, rebounded sharply, up +7.46%, closing at 294.61, penetrating resistance at 285.00, and closing slightly under resistance at 295.00 and below the 50-Day and 200-Day Moving Average (blue and red rectangle).
Resistance is at 295.00, 300.00, 305.00, and 310.00. Sell stops are likely below the lows on 6/16 of 269.28. Note: a close below would give a downside objective on the weekly chart of 258.00.
The middle chart is MACD (12, 26, 9), a measure of momentum; MACD remains on a buy with a fresh rebuy. I would like to see the April downtrend in MACD (purple line) be broken to the upside to confirm downside momentum is likely to be complete.
Money Flow (lower chart) is rising but below resistance (red line).
The jury is out if QQQ will continue higher or begin to consolidate and then test the 6/16 low at 268.76. Time will tell.
Figure 11: Van Eck Semiconductors (SMH) Daily Price (Top), 12-26-9 MACD (Middle), and Money Flow (Bottom)
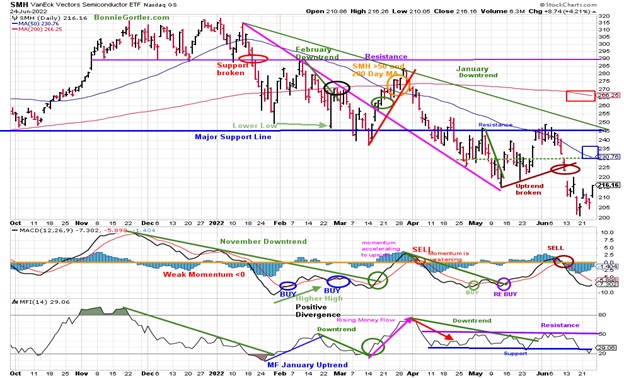
Source: Stockcharts.com
In late January, Van Eck Semiconductors (SMH) support was broken (red circle) and fell sharply but held the October 2021 lows. SMH then rallied but turned down again, closing below support at 240.00 on 3/14/22, a false breakdown. SMH broke the March uptrend (red line) after failing to get above the resistance at 290.00.
SMH, one of the weakest sectors during the decline, fell through support at 220.00 and 215.00 towards the downside target of 200.00. SMH rebounded by +5.11% for the week, closing at 216.16, but below the 50-Day (blue rectangle) and 200-Day MA (red rectangle).
Resistance is 220.00, 232.00, followed by 245.00.
MACD (middle chart) remains on a sell but is rising and close to a buy if SMH continues higher.
Money Flow (lower chart) turned lower after trending sideways since 4/11, unable to get over resistance (purple line), and turned up under the previous support (blue line).
Figure 12: Van Eck Semiconductors (SMH) Weekly
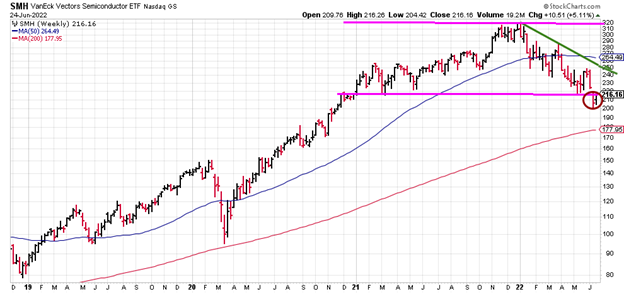
Source: Stockcharts.com
SMH, despite the rally, closed slightly below its weekly channel support at 217.00 (brown circle) and remains in a downtrend (green line).
Figure 13: I Shares Hi-Yield Corporate Bond (HYG) (Top), and 12-26-9 MACD (Bottom)
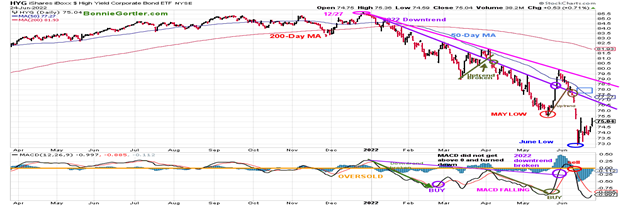
Source: Stockcharts.com
Hi-Yield Bonds (HYG) peaked on 12/27/21, and HYG broke the downtrend in early April (green line), which turned out to be a false breakout followed by a new low in May. A sharp rally followed and failed, followed by a new low.
HYG rose +1.34%, closing at 75.04 last week. It’s worrisome that HYG closed below its 50-Day MA, and Hi-Yield Bond Funds made lower lows this week.
MACD (lower chart) remains on a sell but can generate a new buy with strength in HYG.
Figure 14: Energy SPDR Daily (XLE)
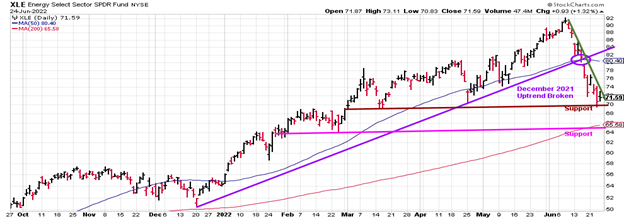
Source: Stockcharts.com
The strongest sector of 2022 Energy (XLE) joined in the decline the previous week falling -by 17.16%, breaking its downtrend from December 2021. This week XLE was down -1.49%, and energy stocks fell by more. Support remains at 70.00 (brown line), followed by 65.00 (pink line), and resistance is at 82.00.
Figure 15: The S&P 500 Index Daily ($SPX)
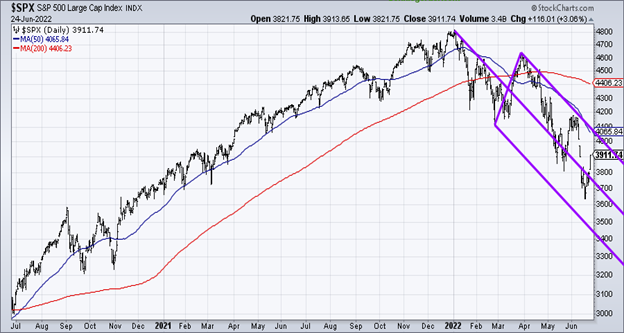
Source: Stockcharts.com
The S&P 500 (SPX) broke the downtrend (pink line) but stalled before hitting the short-term objective of 4276.00. What appeared to be a consolidation of the gains from the May low changed quickly to heavy selling after breaking through support at 3855.00 and the May low.
The S&P 500 (SPX) rose +6.45%, closing at 3911.7. Next week is key to see if there will be follow-through to the rally breaking the downtrend and close above the 50-Day Moving Average.
Resistance is at 4000.00 and 4100.00, followed by 4200.00. The downside objective remains 3500.00.
Figure 16: China Weekly (FXI)
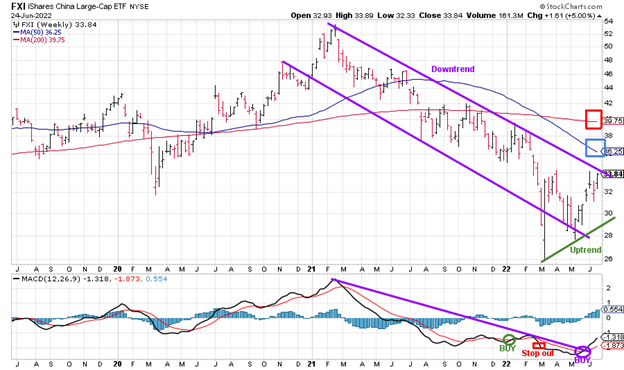
Source: Stockcharts.com
China (FXI), a high-risk international ETF, has been gaining strength since the low made in March 2022 and appears to have successfully tested its March low in May.
FXI has been in an uptrend since March, closing slightly below its downtrend since February 2021, and seems ready to breakout.
Resistance is at 36.25 and 40.00. Support is at 31.00 and 29.00.
MACD is on a buy, and its bullish MACD broke its February 2021 downtrend from March 2021, implying the worst of the downside momentum is complete.
A break of the uptrend would negate the pattern and likely see a test of the March 2022 lows.
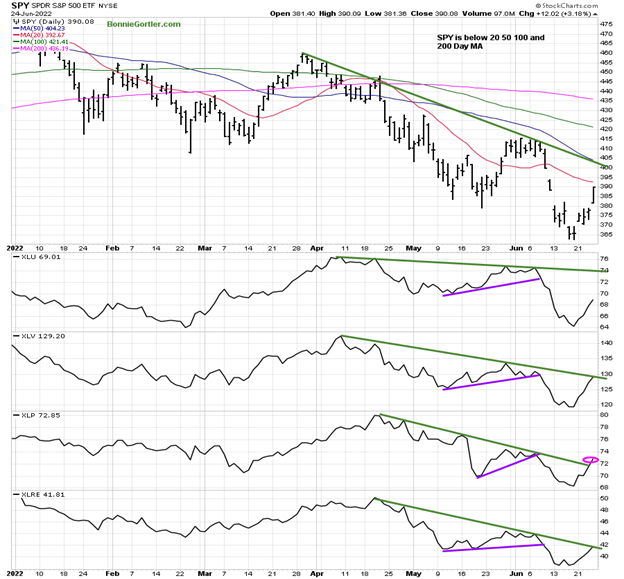
Figure 17: SPDR S&P 500 (SPY) with XLU, XLV, XLP, and XLRE
Source: Stockcharts.com
The top chart shows the SPDR S&P 500 (SPY) with the defensive ETFs of the SPDR sectors, XLU, XLV, XLP, and XLRE below, all of which have been in a downtrend. Notice how XLV and XLRE are close to breaking their April downtrends (green lines) XLP is the first sector to break its April downtrend (pink circle), and XLU is the furthest away. If the defensive sectors breakout to the upside, the aggressive sectors such as Biotechnology (XBI), Technology (XLK), and Consumer Discretionary (XLY) lag; this would give a clue the recent rally could stall soon.
Summing Up
Stocks rebounded last week after breaking below short-term support. With the rally's strength, downside momentum appears to have slowed for now. One week of gains is a start. However, it’s too early to say the market has made a major bottom. More time is needed to see if there will be a continuation of the rally to break the existing downtrends that remain for the short and intermediate term.
Remember to manage your risk, and your wealth will grow.
I would love to hear from you. If you have any questions or comments email me at Bonnie@Bonniegortler.com.
Disclaimer: Although the information is made with a sincere effort for accuracy, it is not guaranteed that the information provided is a statement of fact. Nor can we guarantee the results of following any of the recommendations made herein. Readers are encouraged to meet with their own advisors to consider the suitability of investments for their own particular situations and for determination of their own risk levels. Past performance does not guarantee any future results.


