

Ian Murphy of MurphyTrading.com states; over the weekend queries came in about the bear market and specifically is it over and is it time to get back into stocks?
Let’s look at the question from a fundamental and technical perspective.
Click images to enlarge
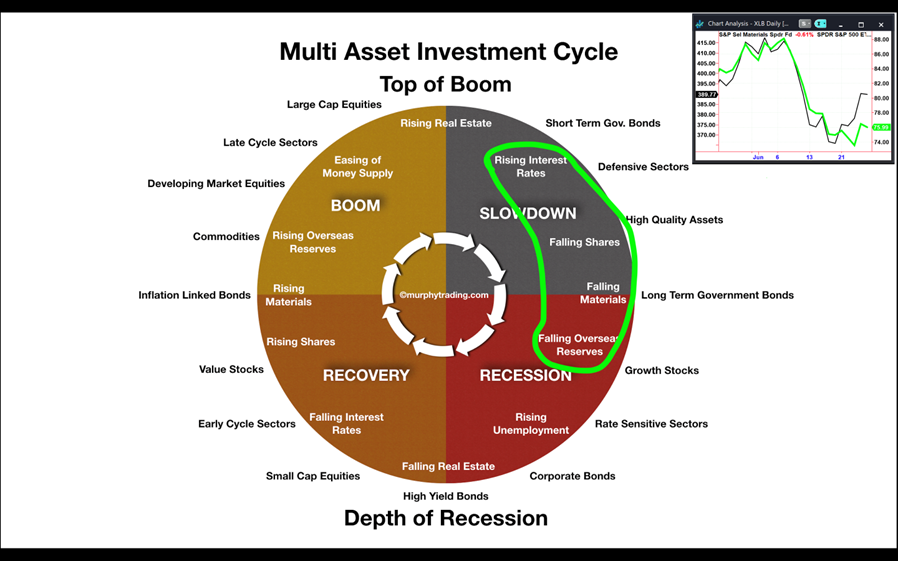
If we cast an eye over the Multi-Asset Investment Cycle (Module Two on the Education page) it’s obvious we are on the right side of the circle as highlighted above. We already have ‘Rising Interest Rates’ and ‘Falling Shares’, while reports of falling commodity prices, especially metals have started appearing in the mainstream media.
The SPDR Materials ETF (XLB) has been falling for the past three weeks (insert chart), so we are beginning to see ‘Falling Materials’ now as well. Soft commodity prices (i.e. foodstuffs) have been uniquely impacted by the war in Ukraine, so the decline should be worse.
Click images to enlarge
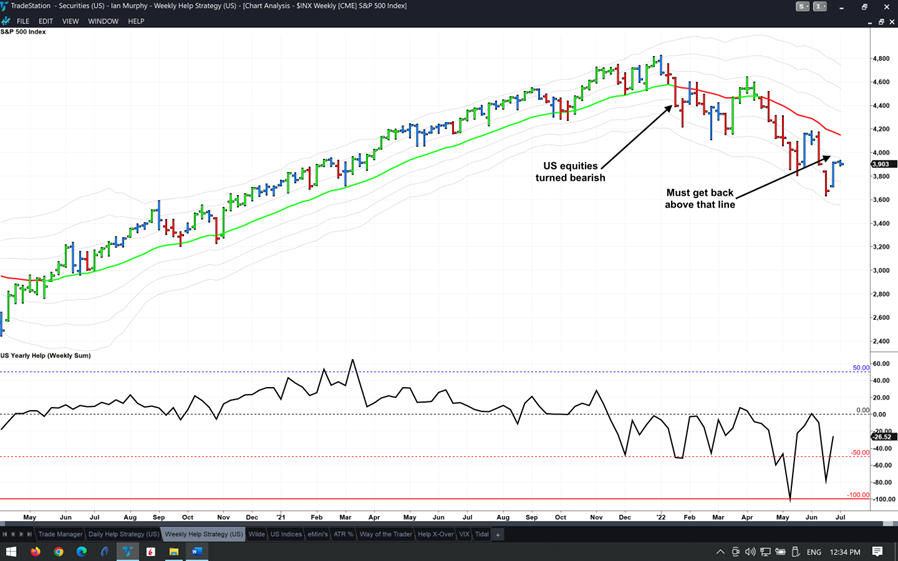
Getting technical, US equities have been bearish since January and last week’s rally, impressive as it is, has not managed to get the S&P 500 (SPX) back above the -1ATR line on a weekly chart (currently 3951.22) or turn a price bar green since April.
This market is still bearish and last week’s rally looks no different from all the other brief but ultimately unsuccessful rallies since January.
Click images to enlarge
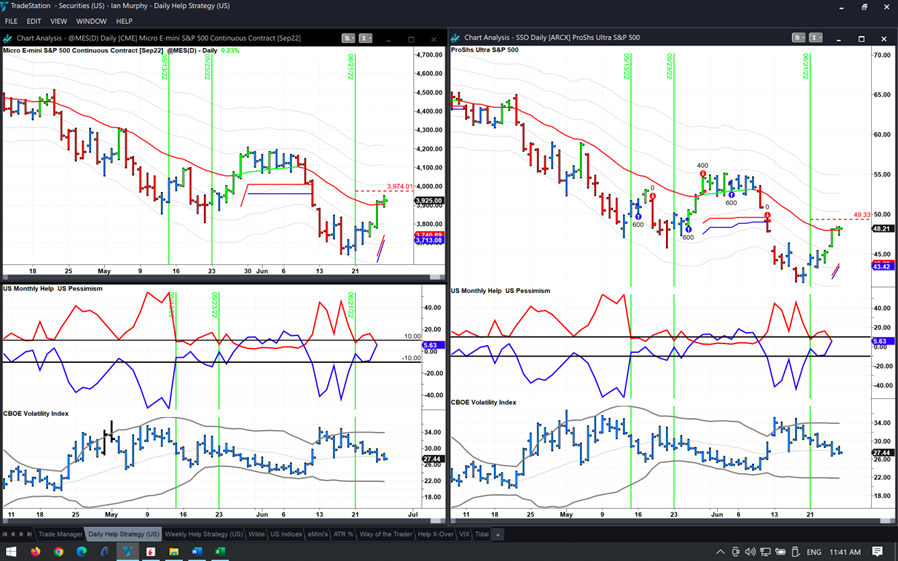
The Daily Help Strategy is performing well since last Tuesday’s trigger and the first target on SSO was hit on Friday. Based on this morning’s price action T2 is within reach for both instruments as shown above with the red dashed line. The trailing stops for SSO and Micro E-mini share are also close to the entry price on both, so it’s unlikely this trade will be loss-making if T2 proves to be a bridge too far.
Learn more about Ian Murphy at MurphyTrading.com.


