

There was not much follow-through to the gains from the previous week, only four of eleven S&P SPDR sectors were higher last week, notes Bonnie Gortler of bonniegortler.com.
Utilities (XLU) and Energy (XLE) led while Technology (XLK) and Consumer Discretionary (XLY) lagged. The SPDR S&P 500 ETF Trust (SPY) fell by -2.27%.
S&P SPDR Sector ETFs Performance Summary 6/24/22 – 7/01/22
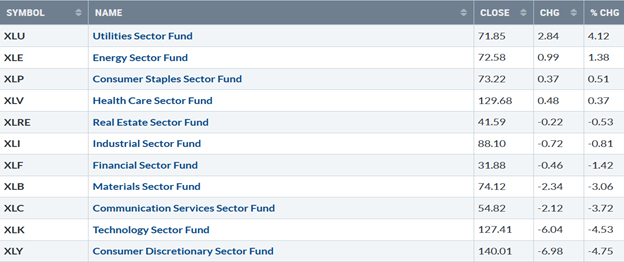
Source: Stockcharts.com
Figure Two: Bonnie's Mix of ETFs Performance Summary 6/24/22 – 7/01/22
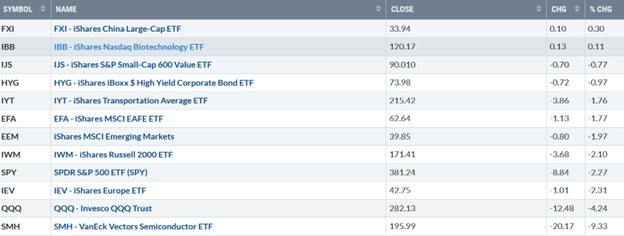
Source: Stockcharts.com
Investors were cautious and unwilling to take on risk. Semiconductors were crushed. Technology and Small-Cap Growth showed no life and were under selling pressure. China held its ground while other global markets and Emerging Markets were down.
Figure Three: UST Ten-Year Bond Yields Daily
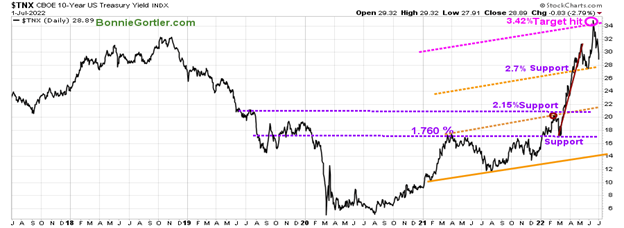
Source: Stockcharts.com
The Ten-Year US Treasury yields (TNX) moved lower for the second week, closing at 2.889% after reaching its upside target in June.
Figure Four: UST Five-Year Bond Yields Daily
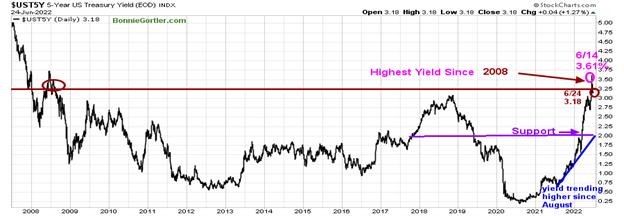
Source: Stockcharts.com
The Five-Year US Treasury yield fell last week, closing at 2.88%, falling from its high of 3.61% on 6/14.
The Dow (DJI) fell -1.28%, S&P 500 (SPX) was down -2.21%, the Nasdaq (NDX) fell -4.13%, The Russell 2000 Index (^RUT) down -2.15%, while The Value Line Arithmetic Index (a mix of approximately 1700 stocks) was lower by -2.08 %.
Weekly market breadth was negative for the New York Stock Exchange Index (NYSE) and Nasdaq. The NYSE had 1559 advances and 1956 declines, with 46 new highs and 548 new lows. There were 1918 advances and 3344 declines on the Nasdaq, with 105 new highs and 945 new lows, once again more new lows than new highs.
Figure Five: Nasdaq Advance-Decline Line (Daily)
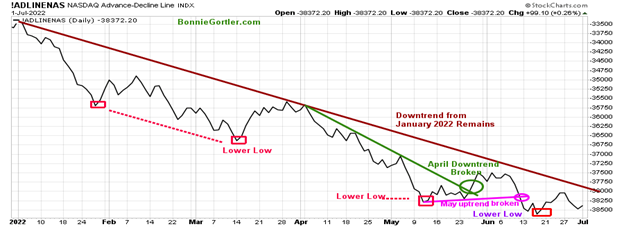
Source: Stockcharts.com
The improvement in breadth at the end of May and early June after breaking its April downtrend didn’t last for long,
Last week market breadth on the Nasdaq fell after stocks bounced from being deeply oversold the previous week. For a sustainable rally that will last for the intermediate-term (weeks to months), improvement in market breadth is necessary, including breaking above the January downtrend (brown line).
Figure Six: NYSE Cumulative Advance-Decline Line
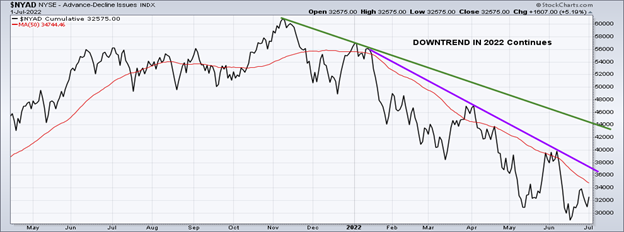
Source: Stockcharts.com
The chart above is a breadth indicator representing the cumulative difference between the number of advancing and declining stocks on the New York Stock Exchange (NYSE). Market breadth has continued to be poor since November 2021 (green line).
A positive sign for the market's tone to change is for the 2022 downtrend to be broken (purple line).
Figure Seven: CBOE Volatility Index VIX
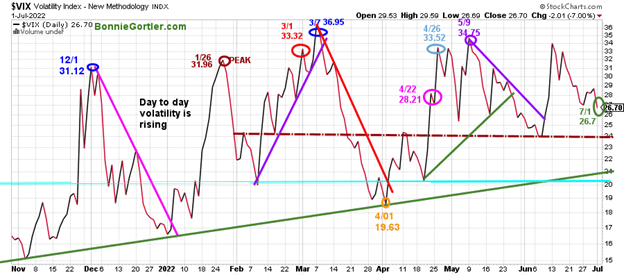
Source: Stockcharts.com
The CBOE Volatility Index (VIX), a measure of fear, has been trading above 20.00 for most of 2022. In January, VIX made a high at 31.96 on 1/26 (brown circle), on 3/1 at 33.32 (red circle), and peaked at 36.95 on 3/7 (blue circle). VIX, through the sell-off, remained below the March peak.
VIX fell slightly last week, closing at 26.70 (green circle) as the market averages fell. Typically VIX would rise.
We have yet to see panic where VIX rises above 40.00 or even 60.00, as seen in the past bear market bottoms.
VIX remains relatively high; therefore, day-to-day volatility could continue to include 2-3% swings on the major averages at any time.
On the other hand, if VIX closes below 24.00, intraday volatility is likely to fall, towards the 4/01 April low (orange circle) at 19.63.
Figure Eight: Daily New York Stock Exchange (NYSE) New Lows
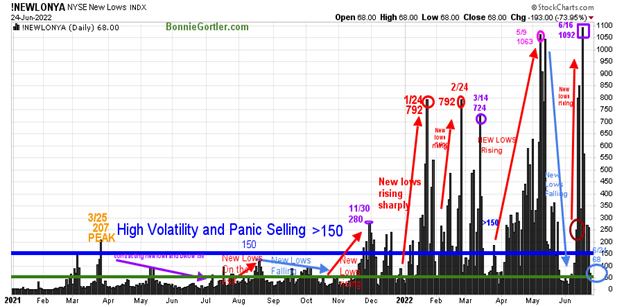
Source: Stockcharts.com
Watching new lows on the New York Stock Exchange is a simple technical tool that helps awareness of the immediate trend's direction.
New lows warned of a potential sharp pullback, high volatility, and "panic selling" for most of 2022, closing above 150. As the market started to move lower in January 2022, new lows rose sharply, peaking at 792 on 1/24 and again on 2/24 (red circles), implying an increased risk of further selling pressure.
Investors in early May unloaded stocks, and new lows expanded to 1063 on 5/9 (pink circle), then on 6/16 (purple rectangle), new lows made a new high of 1092.
Learn more about the significance of new lows in my book, Journey to Wealth, published on Amazon. Here is an excerpt, "When new lows are above 150, the market is negative, higher risk, and selling is taking place. Sometimes it could be severe, and sometimes on a very nasty day, you can have 'panic selling,' and big wild swings (high volatility) to the downside may occur."
New lows shifted to the high-risk zone, above 150, closing at 205 on 6/24 (light blue circle).
It would be encouraging if new lows fall below 150 and then remain between 25 and 50, indicating lower risk and a sign a short-term rally will begin.
On the other hand, it would not be favorable for new lows to remain above 150, then I would expect more weakness in the near term.
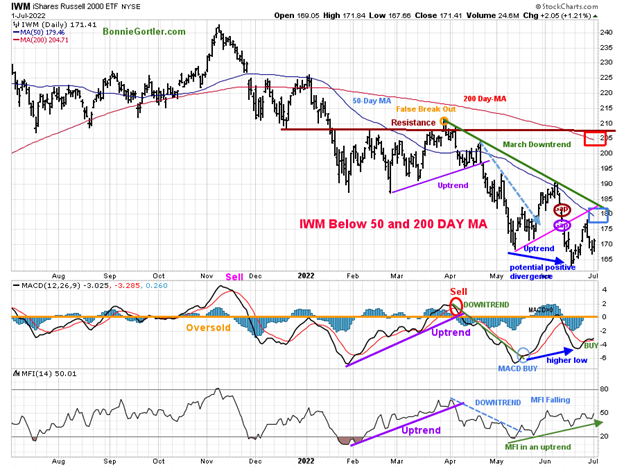
Figure Nine: Daily iShares Russell 2000 (IWM) Price (Top) and 12-26-9 MACD (Middle) and Money Flow (Bottom)
Source: Stockcharts.com
The top portion of the chart is the daily iShares Russell 2000 Index ETF (IWM), the benchmark for small-cap stocks, with a 50-Day Moving Average (MA) (blue line) and 200-Day Moving Average (MA) that traders watch and use to define trends. At the end of March, IWM failed to break out above resistance at 210.00 (orange circle), forming a downtrend (green line).
After IWM fell below support at 183.00, selling accelerated in June, making a new low. IWM closed at 171.41, down -2.10%. The downtrend remains with IWM closing below the 50 and 200-Day Moving Averages (blue and red rectangle), which is still falling.
Short-term resistance is 180.00 and 183.00. Support is between 165.00 and 170.00. Sell stops likely sit below the lows on 6/16 of 162.78, which could fuel more selling and another leg down.
MACD (middle chart) is on a buy with a clear positive divergence, one of my favorite patterns.
Money Flow (lower chart) broke the April downtrend (dotted blue line) but stalled, but it continues to rise despite the decline, implying money is moving into small caps.
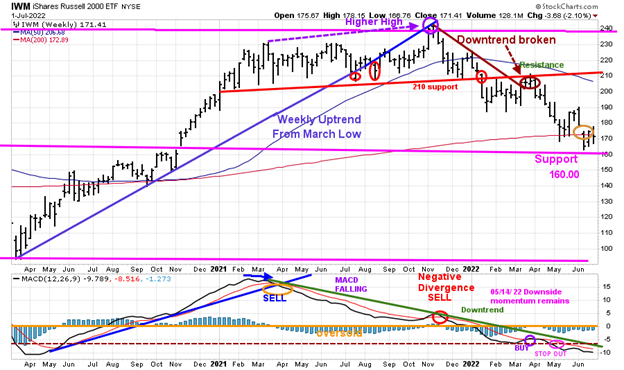
Figure Ten: Daily iShares Russell 2000 (IWM) Price (Top) and 12-26-9 MACD (Bottom)
Source: Stockcharts.com
IWM for the intermediate-term stalled under resistance at 210.00 after breaking the November downtrend and turned down. IWM remains below its 200-Week Moving Average but above channel support at 160.00, a hopeful sign for the bulls.
MACD (lower chart) is on a sell after a premature buy in May, with MACD making a lower low and unable to break the MACD downtrend (green line), implying downside momentum persists.
Time will tell if investors change their minds and are ready to take on more risk. Bottom fishing remains risky with the intermediate trend down until at least the MACD downtrend is no longer in effect.
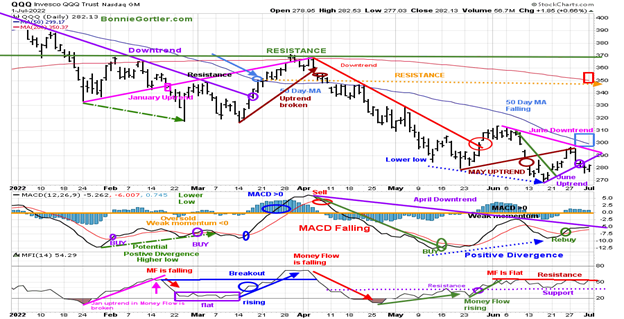
Figure 11: Daily Invesco QQQ Trust (QQQ) Price (Top) and 12-26-9 MACD (Middle) and Money Flow (Bottom)
Source: Stockcharts.com
The chart shows the daily Invesco QQQ (QQQ), an exchange-traded fund based on the Nasdaq 100 Index. After breaking the March uptrend (brown line) at 355.00, QQQ declined sharply, and at the end of May, the short-term trend turned up after breaking the April downtrend (red line), unable to penetrate the 50-Day MA stalling at 315.00 resistance.
QQQ, one of the weakest sectors for the week, failed to break the June downtrend (pink line) and instead broke the June uptrend (purple line) down -4.24%, closing at 282.13. QQQ remains below the downsloping 50-Day and 200-Day Moving Average (blue and red rectangle).
On a positive note, QQQ closed above the June low. Support is between 270 and 275.00. Resistance is at 285.00, 300.00, and 310.00. Sell stops are likely below the lows on 6/16 of 269.28. Note: a close below would give a downside objective on the weekly chart of 258.00.
The middle chart is MACD (12, 26, 9), a measure of momentum; MACD remains on a buy with a positive divergence. I would like to see the April downtrend in MACD (purple line) be broken to the upside to confirm downside momentum is likely to be complete.
Money Flow (lower chart) is rising but below resistance (red line) and holding support.
The jury is out if QQQ will go higher or test the 6/16 low at 268.76. Time will tell.
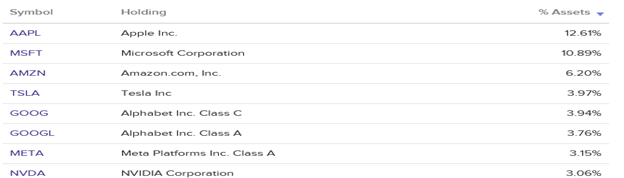
Figure 12: Top Holdings of QQQ as of 6/30/22
Source ETFdb.com
Figure 13: AAPL - Apple, Inc
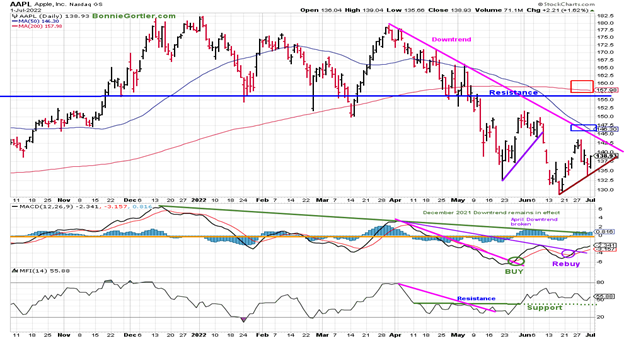
Apple (AAPL), down -1.93% last week, the top holding (12.61%) in QQQ, remains in a downtrend and below its 50 and 200-Day MA. Next week, keep an eye on the strength or weakness for a clue of direction.
Resistance is at 144.00, 147.00, and 158.00. A close above 158.00 could hit buy stops of institutions and likely excite the bulls. Support is at 135.00, followed by 130.00
MACD (middle chart) remains on a buy (green circle) and a rebuy. The April July downtrend has broken, implying downside momentum has waned.
Money Flow (lower chart) is rising and above support (green dotted line).
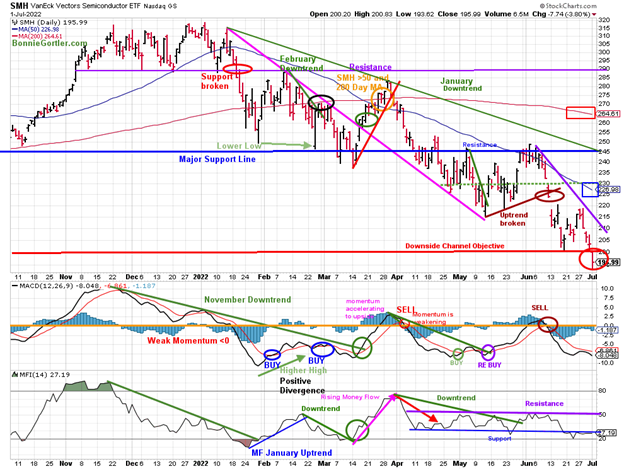
Figure 14: Van Eck Semiconductors (SMH) Daily Price (Top), 12-26-9 MACD (Middle), and Money Flow (Bottom)
Source: Stockcharts.com
In late January, Van Eck Semiconductors (SMH) support was broken. SMH then rallied but turned down again, closing below support at 240.00 on 3/14/22, a false breakdown. SMH broke the March uptrend (red line) after failing to get above the resistance at 290.00.
SMH remains a vulnerable sector, down -9.33 for the week, closing below the daily downside objective at 195.99 and remaining below the downsloping 50-Day (blue rectangle) and 200-Day MA (red rectangle).
Resistance is 200.00 and 220.00.
MACD (middle chart) remains on a sell.
Money Flow (lower chart) After trending sideways since 4/11, unable to get over resistance (purple line), money flow turned lower and is moving sideways under support (blue line).
Figure 15: Van Eck Semiconductors (SMH) Weekly
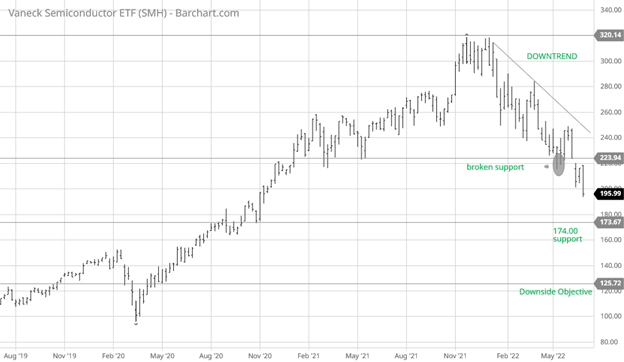
Source: Barchart.com
SMH closed below its weekly channel support and remains in a downtrend. The next downside objective is 174.00, followed by 125.00.
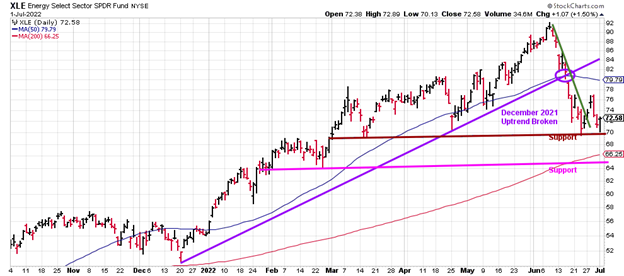
Figure 16: Energy SPDR Daily (XLE)

Source: Stockcharts.com
XLE, the strongest sector of 2022 Energy (XLE), held key support last week at 70.00, closing at 72.58, up 1.38%.
Support remains at 70.00 (brown line), followed by 65.00 (pink line), with resistance at 78.00 followed by 84.00.
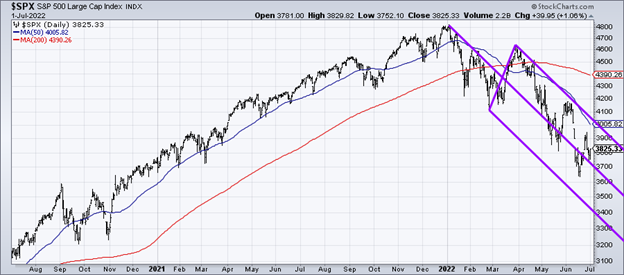
Figure 17: The S&P 500 Index Daily ($SPX)
Source: Stockcharts.com
The S&P 500 (SPX) fell by -2.22%, closing at 3825.33. Next week is key to see if the June low holds and if SPX has enough strength to break the upper channel at 4100.00, which would close above the 50-Day Moving Average.
Resistance is at 4100.00, followed by 4200.00, and support is at 3700.00. The downside objective remains 3500.00.
Figure 18: China Weekly (FXI)
Source: Stockcharts.com
China (FXI), a high-risk international ETF, has been gaining strength since the low made in March 2022 and appears to have successfully tested its March low in May.
FXI has been in an uptrend since March, closing slightly below its downtrend since February 2021, and seems ready to breakout.
Resistance is at 36.25 and 40.00. Support is at 32.00, 31.00, and 29.00.
A break of the uptrend (green line) would negate the pattern and likely see a test of the March 2022 lows.
MACD remains on a buy, and its bullish MACD broke its February 2021 downtrend from March 2021, implying the worst of the downside momentum is complete.
Summing Up:
Despite the market weakness last week, momentum patterns improved. Be alert to a potential change in the short-term trend. It’s encouraging that no new low occurred in the major averages, and positive divergences are beginning to form. Keep an eye on Nasdaq 100 (QQQ), Apple (AAPL), and Russell 2000 (IWM) for short-term direction to see if the decline will continue or if the bulls will step in to buy and squeeze the shorts to cover breaking the existing downtrends.
Remember to manage your risk, and your wealth will grow.
I would love to hear from you. If you have any questions or comments or would like to talk about the market, email me at Bonnie@Bonniegortler.com.
Disclaimer: Although the information is made with a sincere effort for accuracy, it is not guaranteed that the information provided is a statement of fact. Nor can we guarantee the results of following any of the recommendations made herein. Readers are encouraged to meet with their own advisors to consider the suitability of investments for their own particular situations and for determination of their own risk levels. Past performance does not guarantee any future results.


