

Forget the market’s external troubles and instead focus on liquidity, states Joe Duarte, editor of In the Money Options.
The fact is that while the pundits argue about whether we are in a recession or not when it comes to the stock market, the only thing that matters is liquidity—the amount of money available to trade stocks.
And despite the generally difficult external environment and Fed’s best efforts, recently there have been some subtle signs that liquidity in the markets may be improving. Of course, improved liquidity is the lifeblood of advances in stock prices.
In my recent, Your Daily Five video I highlighted a little-known but highly useful indicator of the MELA system’s (M–markets, E–economy, L–life decisions, A–Artificial Intelligence) liquidity—the Eurodollar Index. In the video, I noted that the indicator seems to have bottomed out.
The relationship between stock prices and liquidity is built around interest rates. Generally speaking:
- Rising interest rates decrease liquidity
- Decreased liquidity increases bearish sentiment
- Rising bearish sentiment leads to falling stock prices
This relationship is well supported by the XED chart below, which shows that a fall in XED, caused by rising interest rates, leads to a rise in the CBOE Volatility Index (VIX) (a rise in bearish sentiment which is illustrated by a rise in put option volume). The rise in put option volume then causes an increase in stock selling which pushes the price of the S&P 500 (SPX) lower.
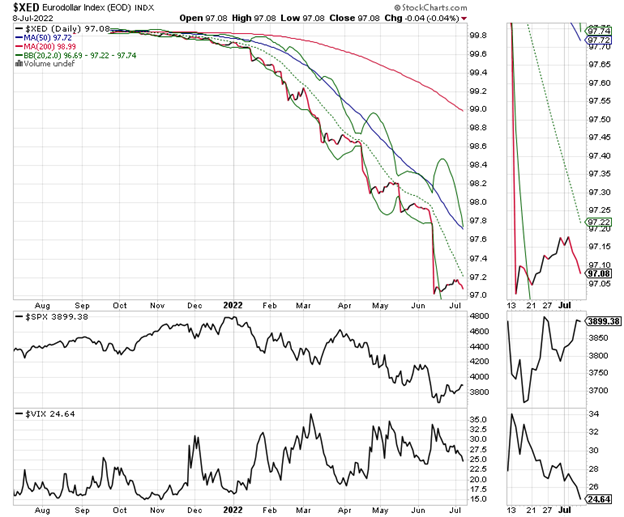
Currently, the action in the chart suggests that liquidity is no longer contracting, although there is no sign that it is expanding aggressively. Still, this bottoming out is predictably having a positive effect on the S&P 500.
So, the real question is whether this is the proverbial “dead cat bounce,” or perhaps the start of what could be a significant bottoming process for stocks.
A failure of XED to remain above the 97 area would likely signal that liquidity is contracting and that the rally is likely over.
Money Flows Suggest Wall Street Is Betting on a Recession
If indeed, the stock market is in the process of bottoming out due to improved—or at least not worsening—liquidity, it’s a good idea to see where the money is going and where it’s not. Here are three interesting areas.
First, there is the biotech sector, as in the iShares Nasdaq Biotech Index (IBB), which is up nearly 20% from its recent double bottom.
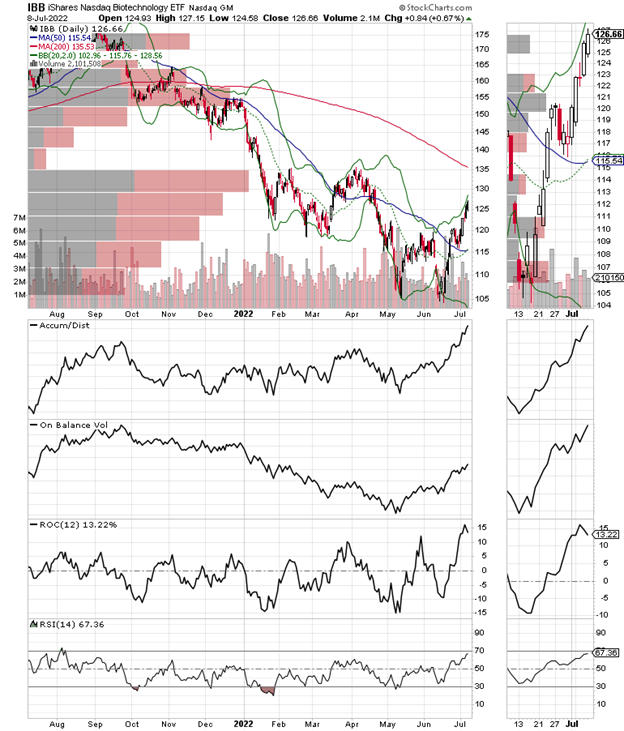
It’s pretty obvious that money has been moving into IBB aggressively as both Accumulation Distribution (ADI) and On Balance Volume (OBV) are moving higher.
Meanwhile, the Volume by Price (VBP) indicator shows a big price bar near $135, which also corresponds to the 200-day moving average. Thus, it’s that price area that will likely make or break the rally in biotech.
The second area is pharmaceuticals, which is increasingly difficult to differentiate from biotech given that there have been several mergers and acquisitions by big pharma companies which have led to more hybrid corporate entities.
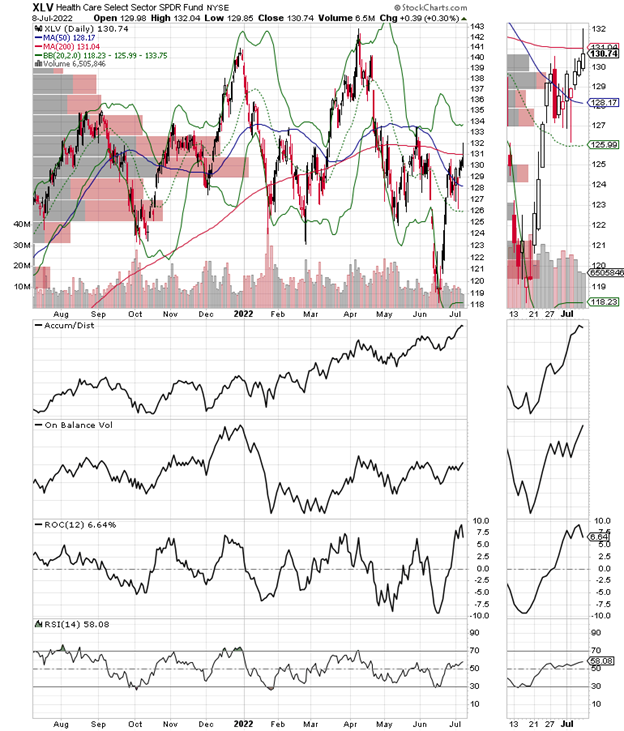
Be that as it may, however, the Health Care Sector SPDR ETF (XLV), which includes, hospitals, health insurers, wholesalers, drug store chains, and big pharma and biotech companies have been doing quite well on its own.
XLV has indeed bounced back to its 200-day moving average with resistance at the $132-$133 price area which also corresponds to two big VBP bars. ADI and OBV for XLV are also very constructive.
On the other hand, the energy sector, despite all the media attention has been getting clobbered with the Energy Sector SPDR ETF (XLE) down nearly 30% from its June 2022 high.
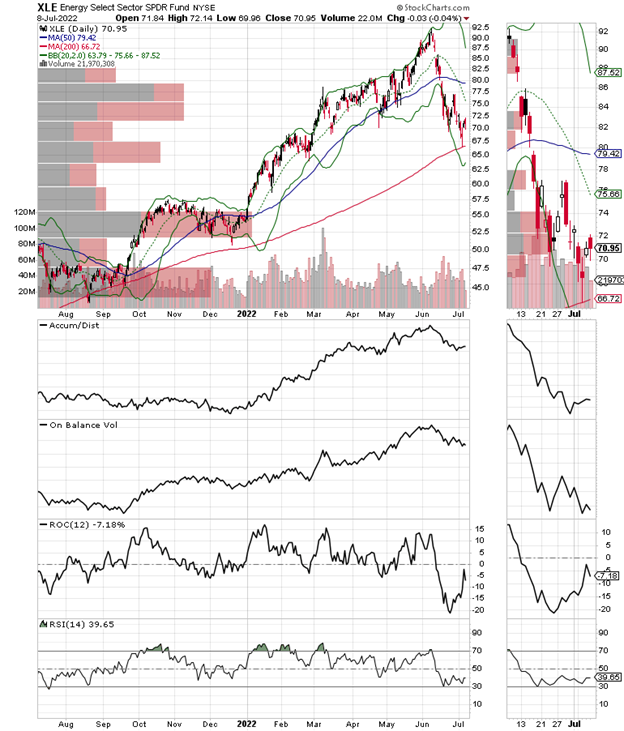
Here we see that XLE crashed through key support between $75-$80 where two very large VBP bars failed to bring in buyers. Now, the ETF is trying to find support at its 200-day moving average, which also corresponds to fairly good-sized VBP bars.
The takeaway is that health care stocks are attracting money while energy stocks are not. If there is an economic message here it’s that the stock market is betting on a recession.
On the other hand, it’s also worth watching for possible reversals in these sectors as conditions evolve.
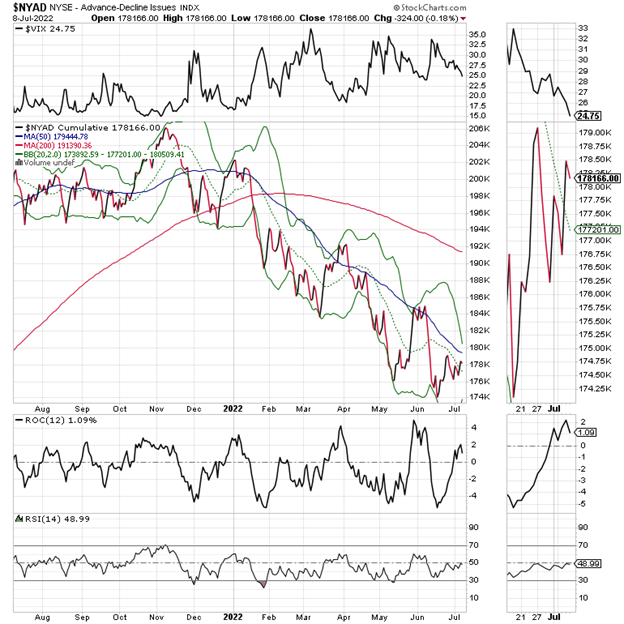
VIX Rolls Over Further. NYAD Holds Steady
The NYAD Advance-Decline line (NYAD) has been improving late. So even if it’s nowhere near a new high, at least it’s no longer making new lows on a regular basis.
Moreover, it’s trying to move above its 20 and 50-day moving averages. If it can accomplish these two tasks, I expect the rally will gather steam.
Meanwhile, the CBOE Volatility Index (VIX) continues to make new lows, which should be more bullish for stocks than it has been so far.
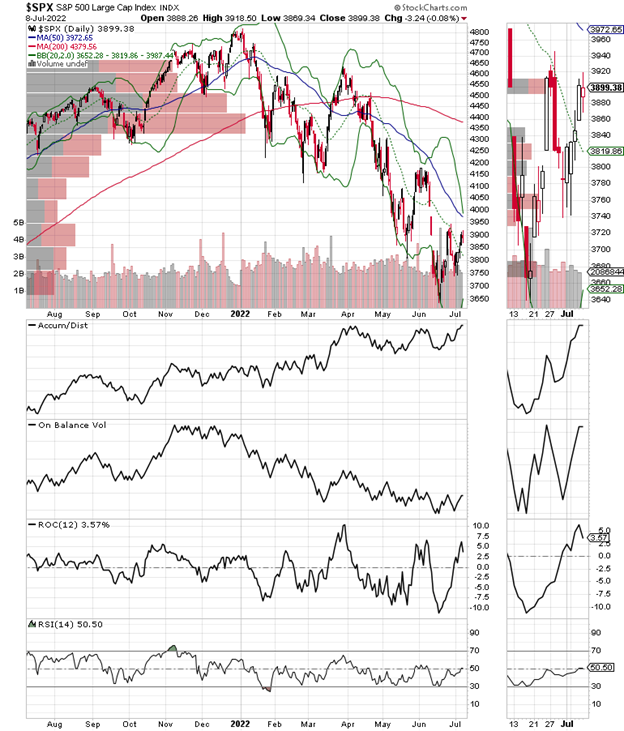
The S&P 500 (SPX) is continuing its bottoming process. The index has now managed a marginal close above 3900 and has room to run toward 4000. Accumulation Distribution (ADI) is rising which means short covering is ongoing. A turn-up in On Balance Volume (OBV) would be very encouraging.
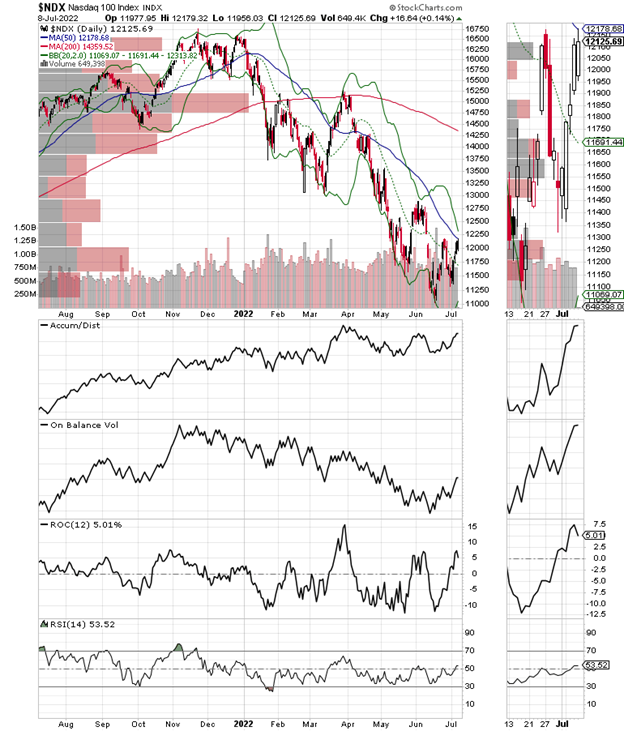
The Nasdaq 100 Index (NDX) has moved above its 20-day moving average and may have a fighting chance to move above the 50-day and the 12500 area if liquidity conditions improve. Accumulation Distribution (ADI) and On Balance Volume (OBV), are showing some steady improvement.
What comes next is clearly going to hinge on what happens if and when the major indexes reach and test the approaching resistance levels. And, of course, that will depend on the liquidity available in the market.
To learn more about Joe Duarte, please visit JoeDuarteintheMoneyOptions.com.


