

Joseph Kennedy, the 35th President’s father, supposedly said right before the 1929 crash, “If shoeshine boys are giving stock tips, then it’s time to get out of the market,” states Brett Friedman of Winhall Risk Analytics.
Although most likely apocryphal, it does point out that we all have our own personal overbought/oversold indicators. For me, it’s when distant relatives start asking me about what’s going on in the “stock market,” or for my take on whether “they should be worried.”
As you can probably guess, inflation and the specter of returning to the bad old days of ‘70s stagflation is on many individuals’ minds right now. The latest June CPI figures of 9.1%, a 41-year high, are cause for concern. Using my personal overbought/oversold indicator, and some recent commodity price trends, could this be a sign that inflation is peaking?
Commodities might tell the tale. Many speculated that the disruptions to supply, resulting from the Ukrainian War, heralded the start of a new commodity supercycle and recommended that investors consider including commodities in their portfolios. As the more apocalyptic predictions fail to materialize and the military stalemate drags on, the war is no longer supplying the physical and psychological shocks necessary to maintain the commodity rally. US-based markets have grown accustomed to the war and have moved on to inflation and recession as the predominant headline items.
At the same time, evidence of an upcoming recession, demand destruction due to high prices (witness, gasoline), and a dollar at, or near, parity with the Euro, have also weighed on commodity prices. Although this hasn’t gotten much attention in the popular press, energy, agricultural, metals, and lumber prices have been falling since early June, and by significant amounts. Indeed, the Goldman Sachs Commodity Index (GSCI) peaked on June eighth and has declined 19.4% since then, along with other bellwether commodities:
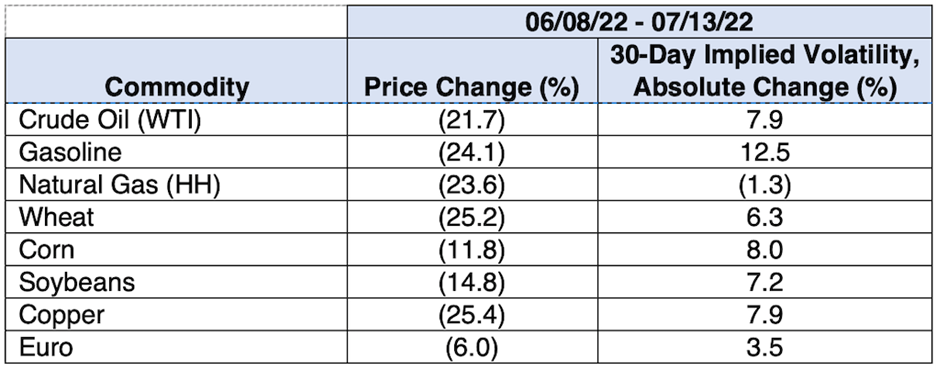
Source: OptionMetrics
The link between commodity prices and inflation has been studied by the St. Louis Fed, which concluded that “commodity prices that have a relatively high energy component are more highly correlated with headline inflation than those commodity price indexes composed mostly of metals or agricultural commodities.”
Interestingly, and despite the fact that commodity prices have been declining to more “normal” levels, their implied volatilities have been moving up (see above). The main factors behind this are the extent and rapidity of the declines and the tendency of commodity implied volatilities to move higher as their prices decline.
Net result: eventually, steep commodity price declines should help to mitigate inflationary pressures in the US and may argue for a less aggressive Fed policy stance.
Let’s review the evidence from a few commodity groups.
Energy
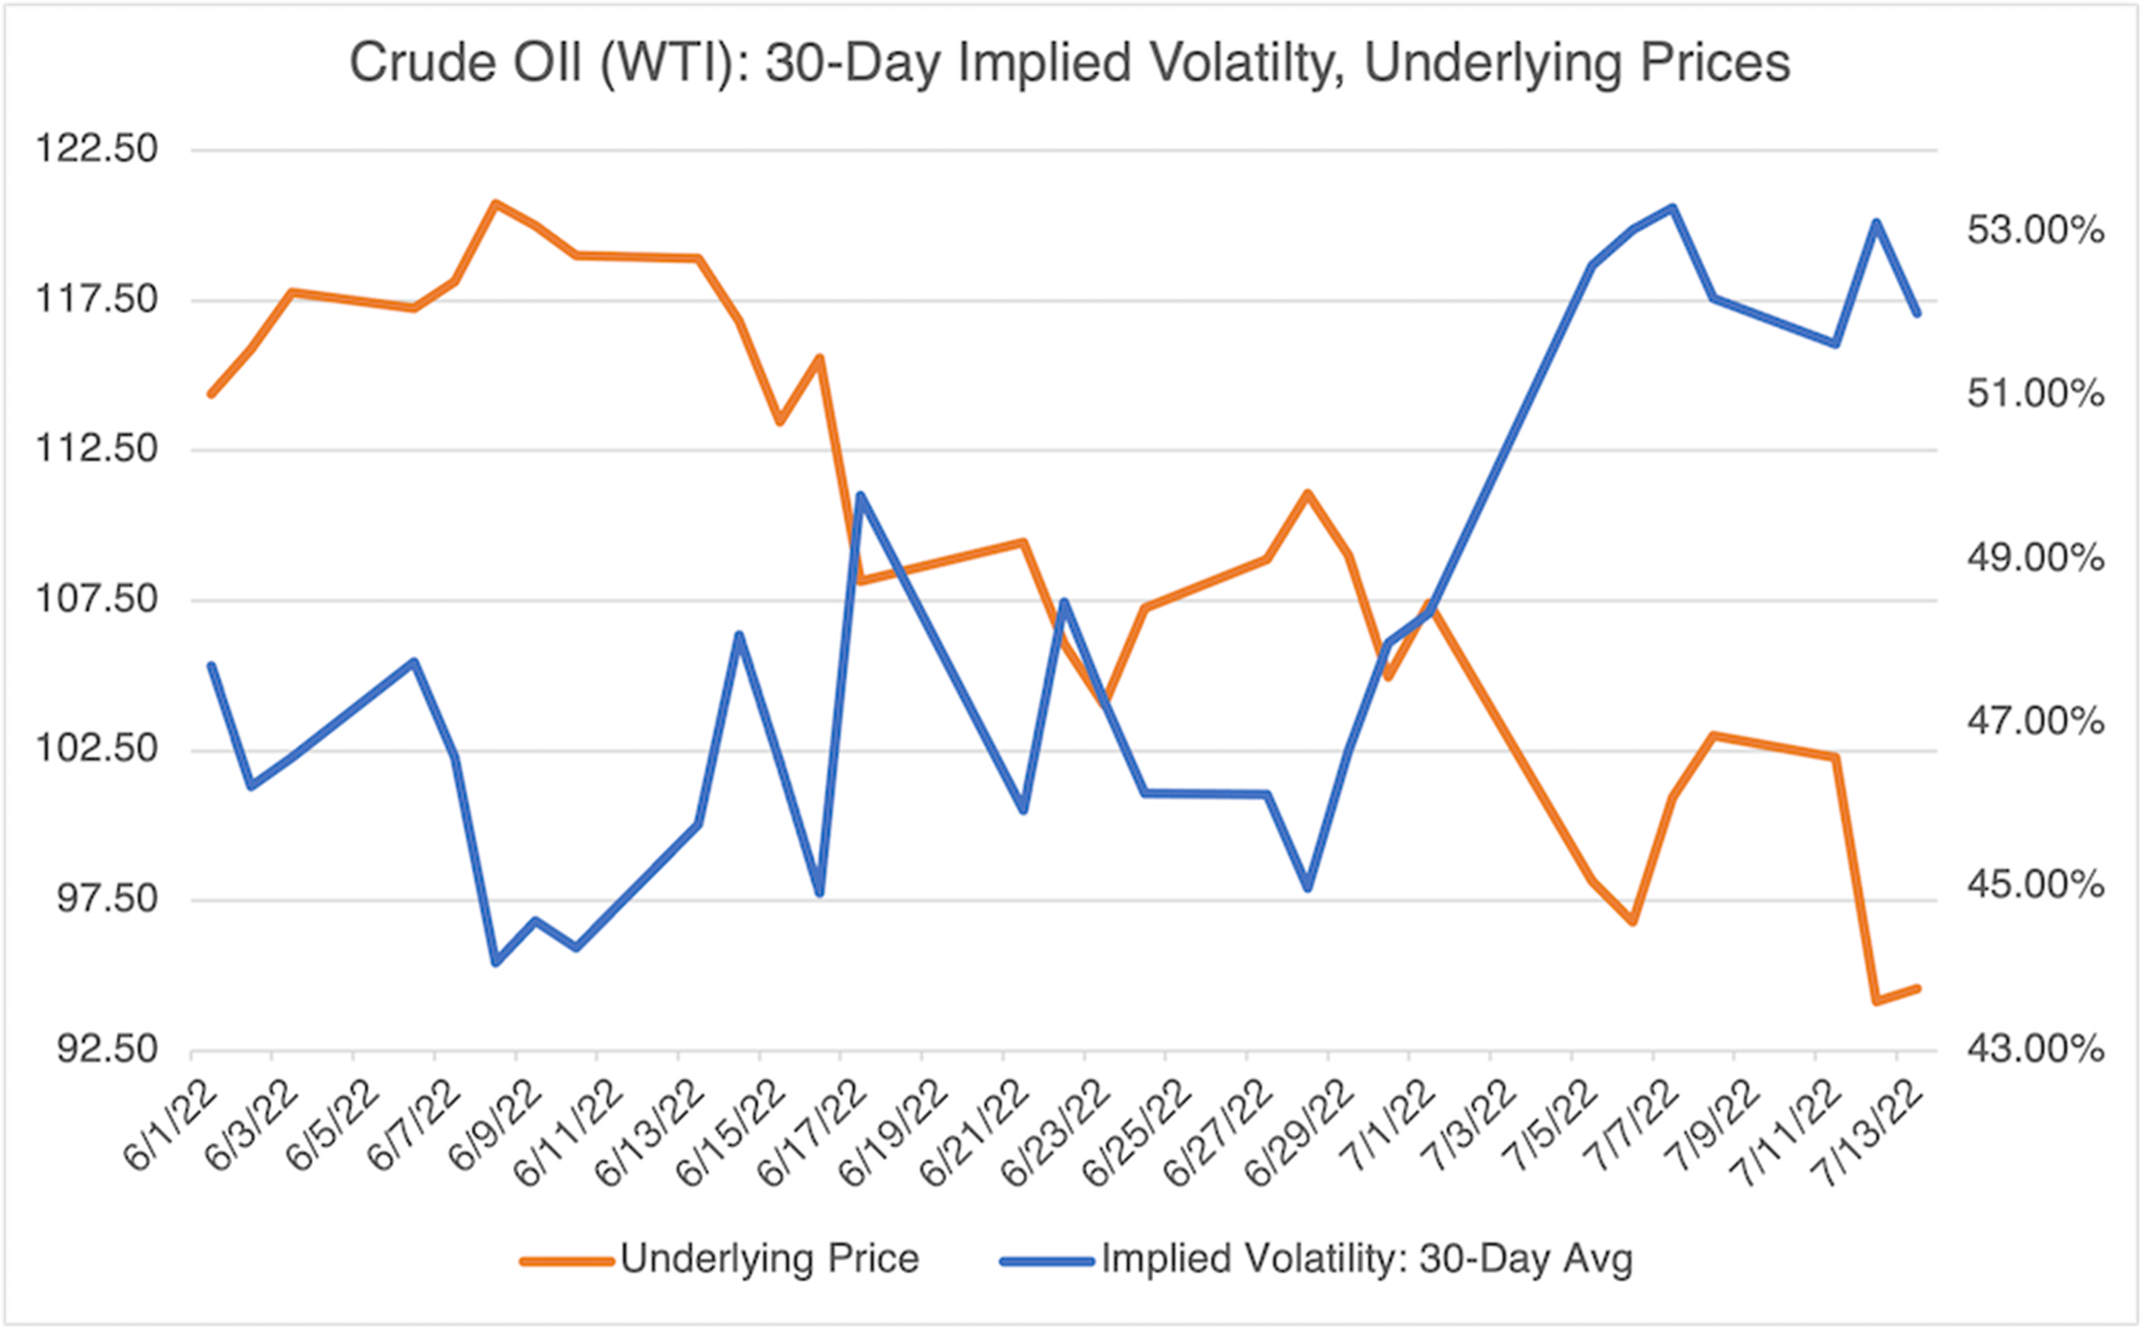
First up is the group that has gotten the most attention over the last few months, energy, and specifically, gasoline. Retail Gasoline Prices (RB=F) (which led the June CPI figure), have moderated slightly over the last few weeks, reflecting the 24% decline in futures prices since early June.
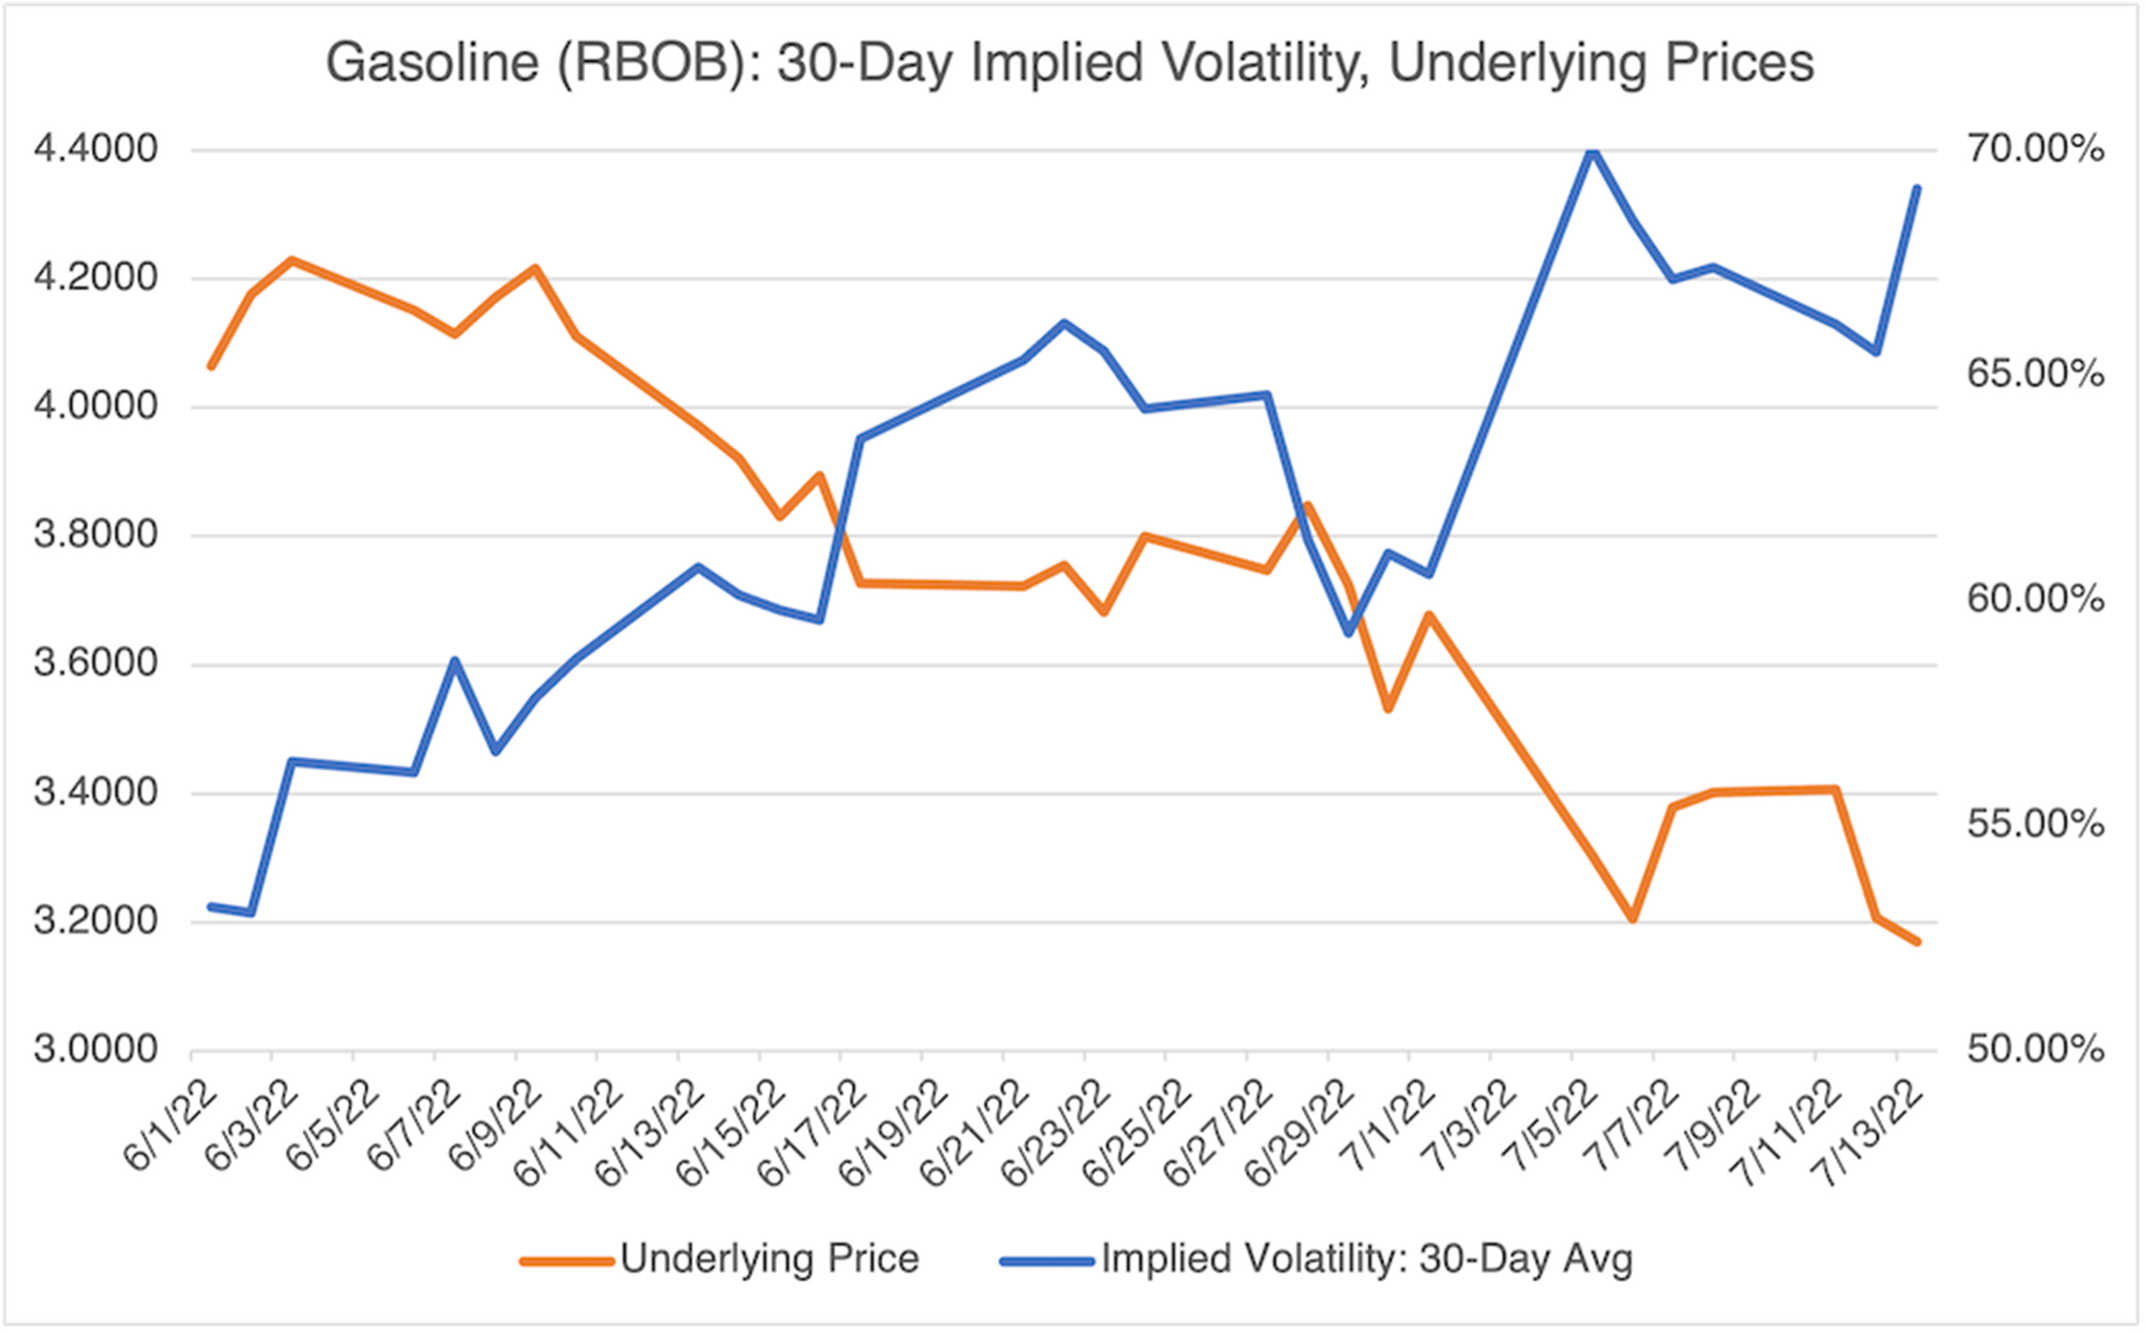
Source: OptionMetrics
Source: OptionMetrics
Obviously, gasoline has been affected by the decline in crude prices. Notice crude’s implied volatility—as is the case with most commodities, it is very sensitive to price declines and showed its highest reading ever (197.4%) when crude went negative intraday in April 2020. The same is true for gasoline.
Source: OptionMetrics
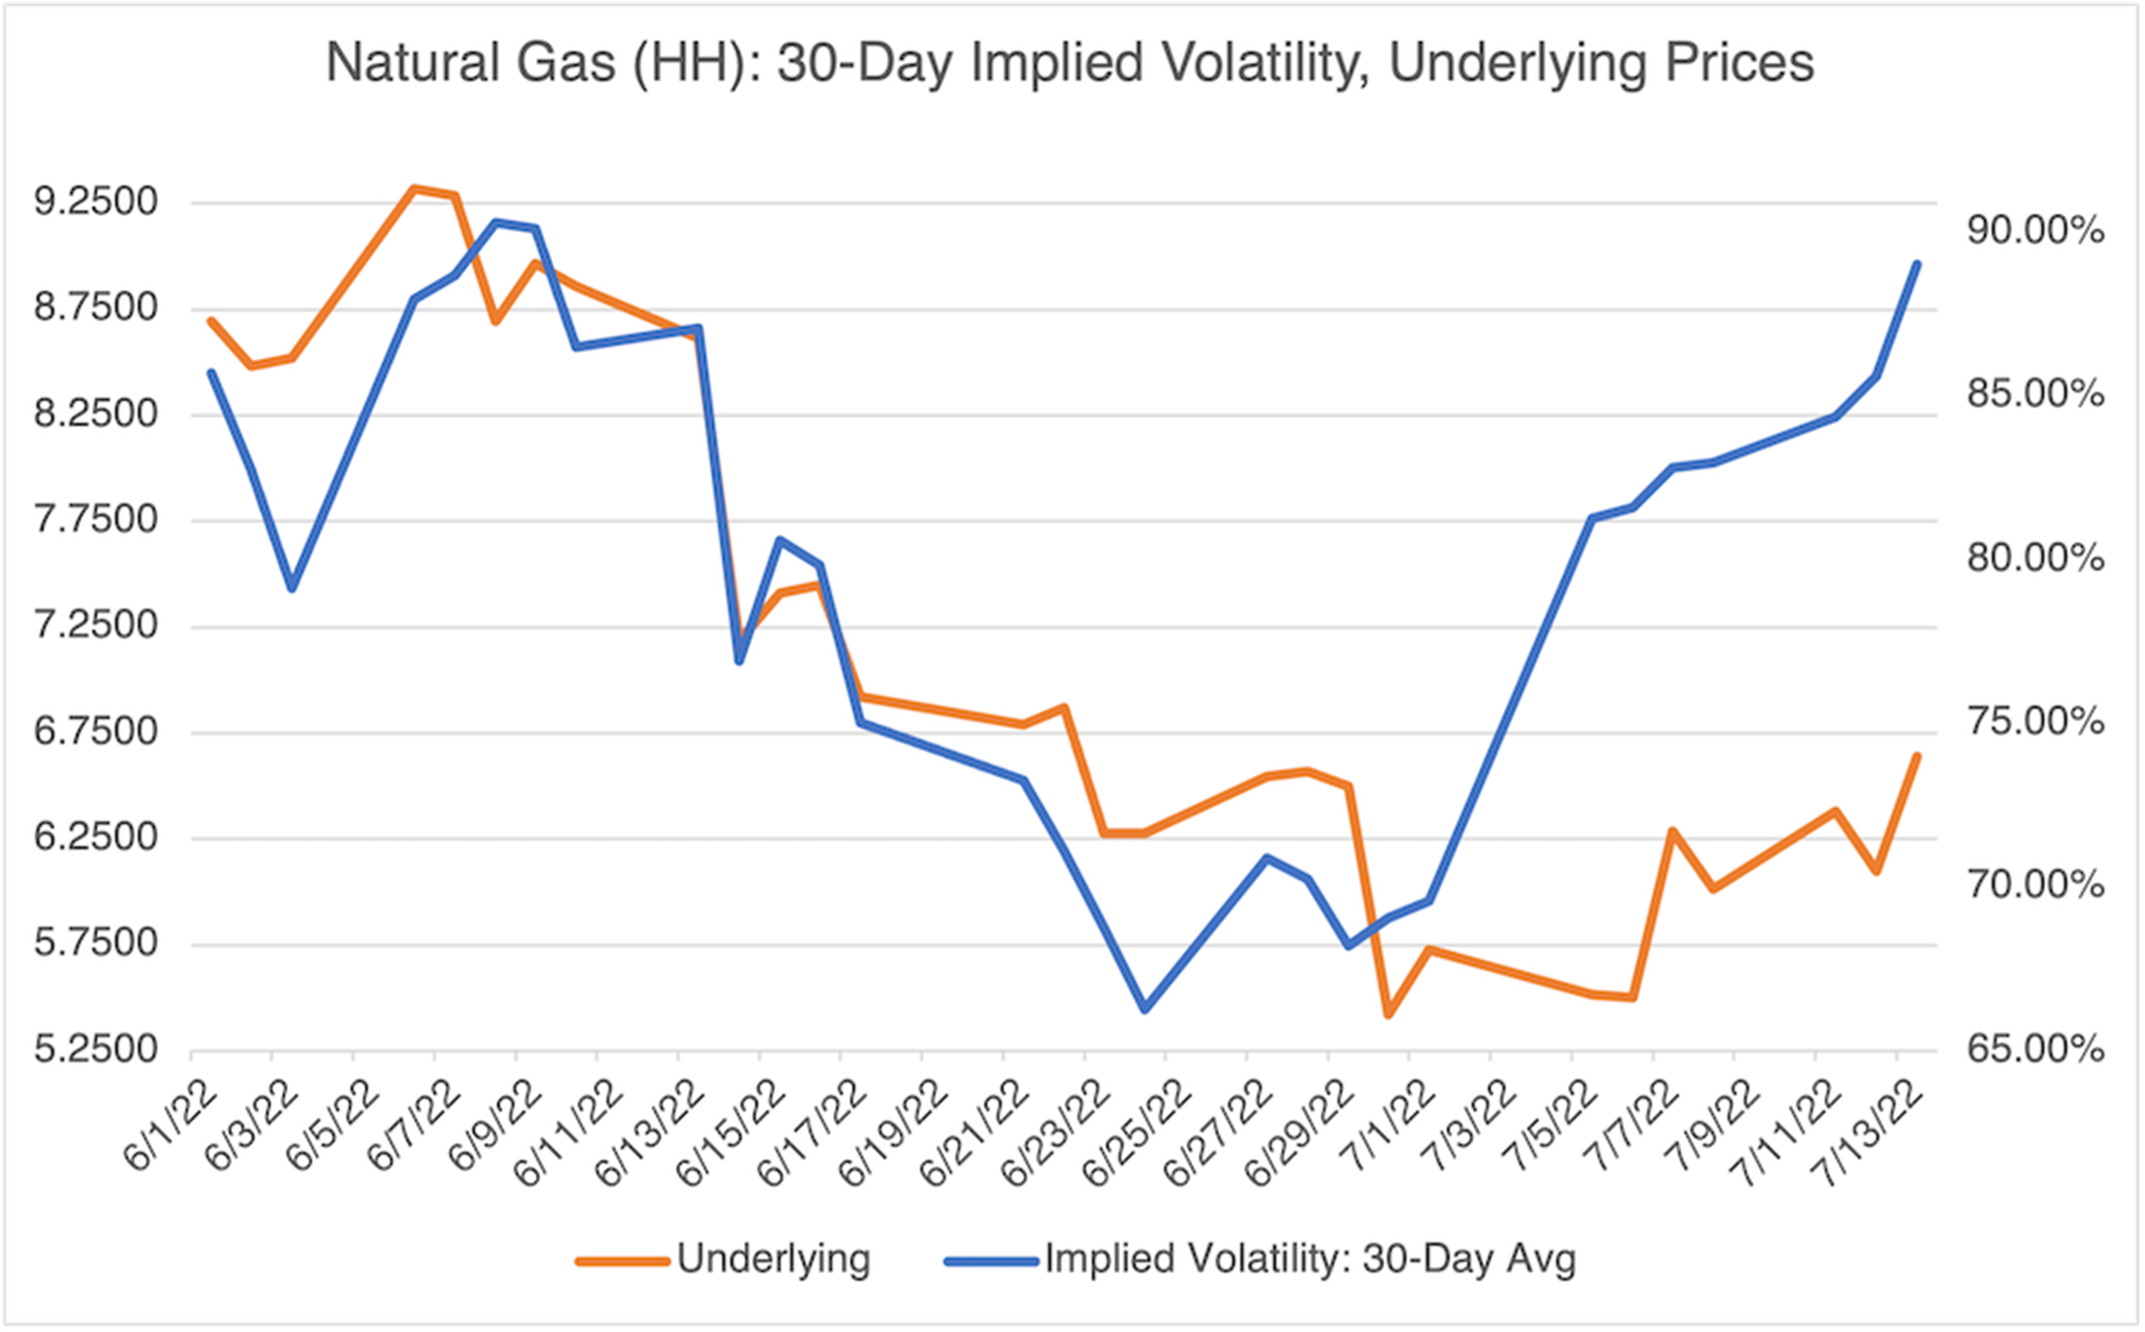
Of special note is the 23% increase in natural gas volatility since June 24 and the slight pickup in prices. Apparently, US natural gas is still affected by Putin’s threats to curtail European supply, albeit to a much lesser extent than in European natural gas markets. The specter of rationing for the upcoming winter looms large, especially in Germany.
Agriculture
Chicago Wheat (ZW=F) is showing some of the most impressive declines in the agriculture sector and is down over 25% since June eighth, with a commensurate increase in implied volatility. Similar moves have occurred in corn and soybeans.
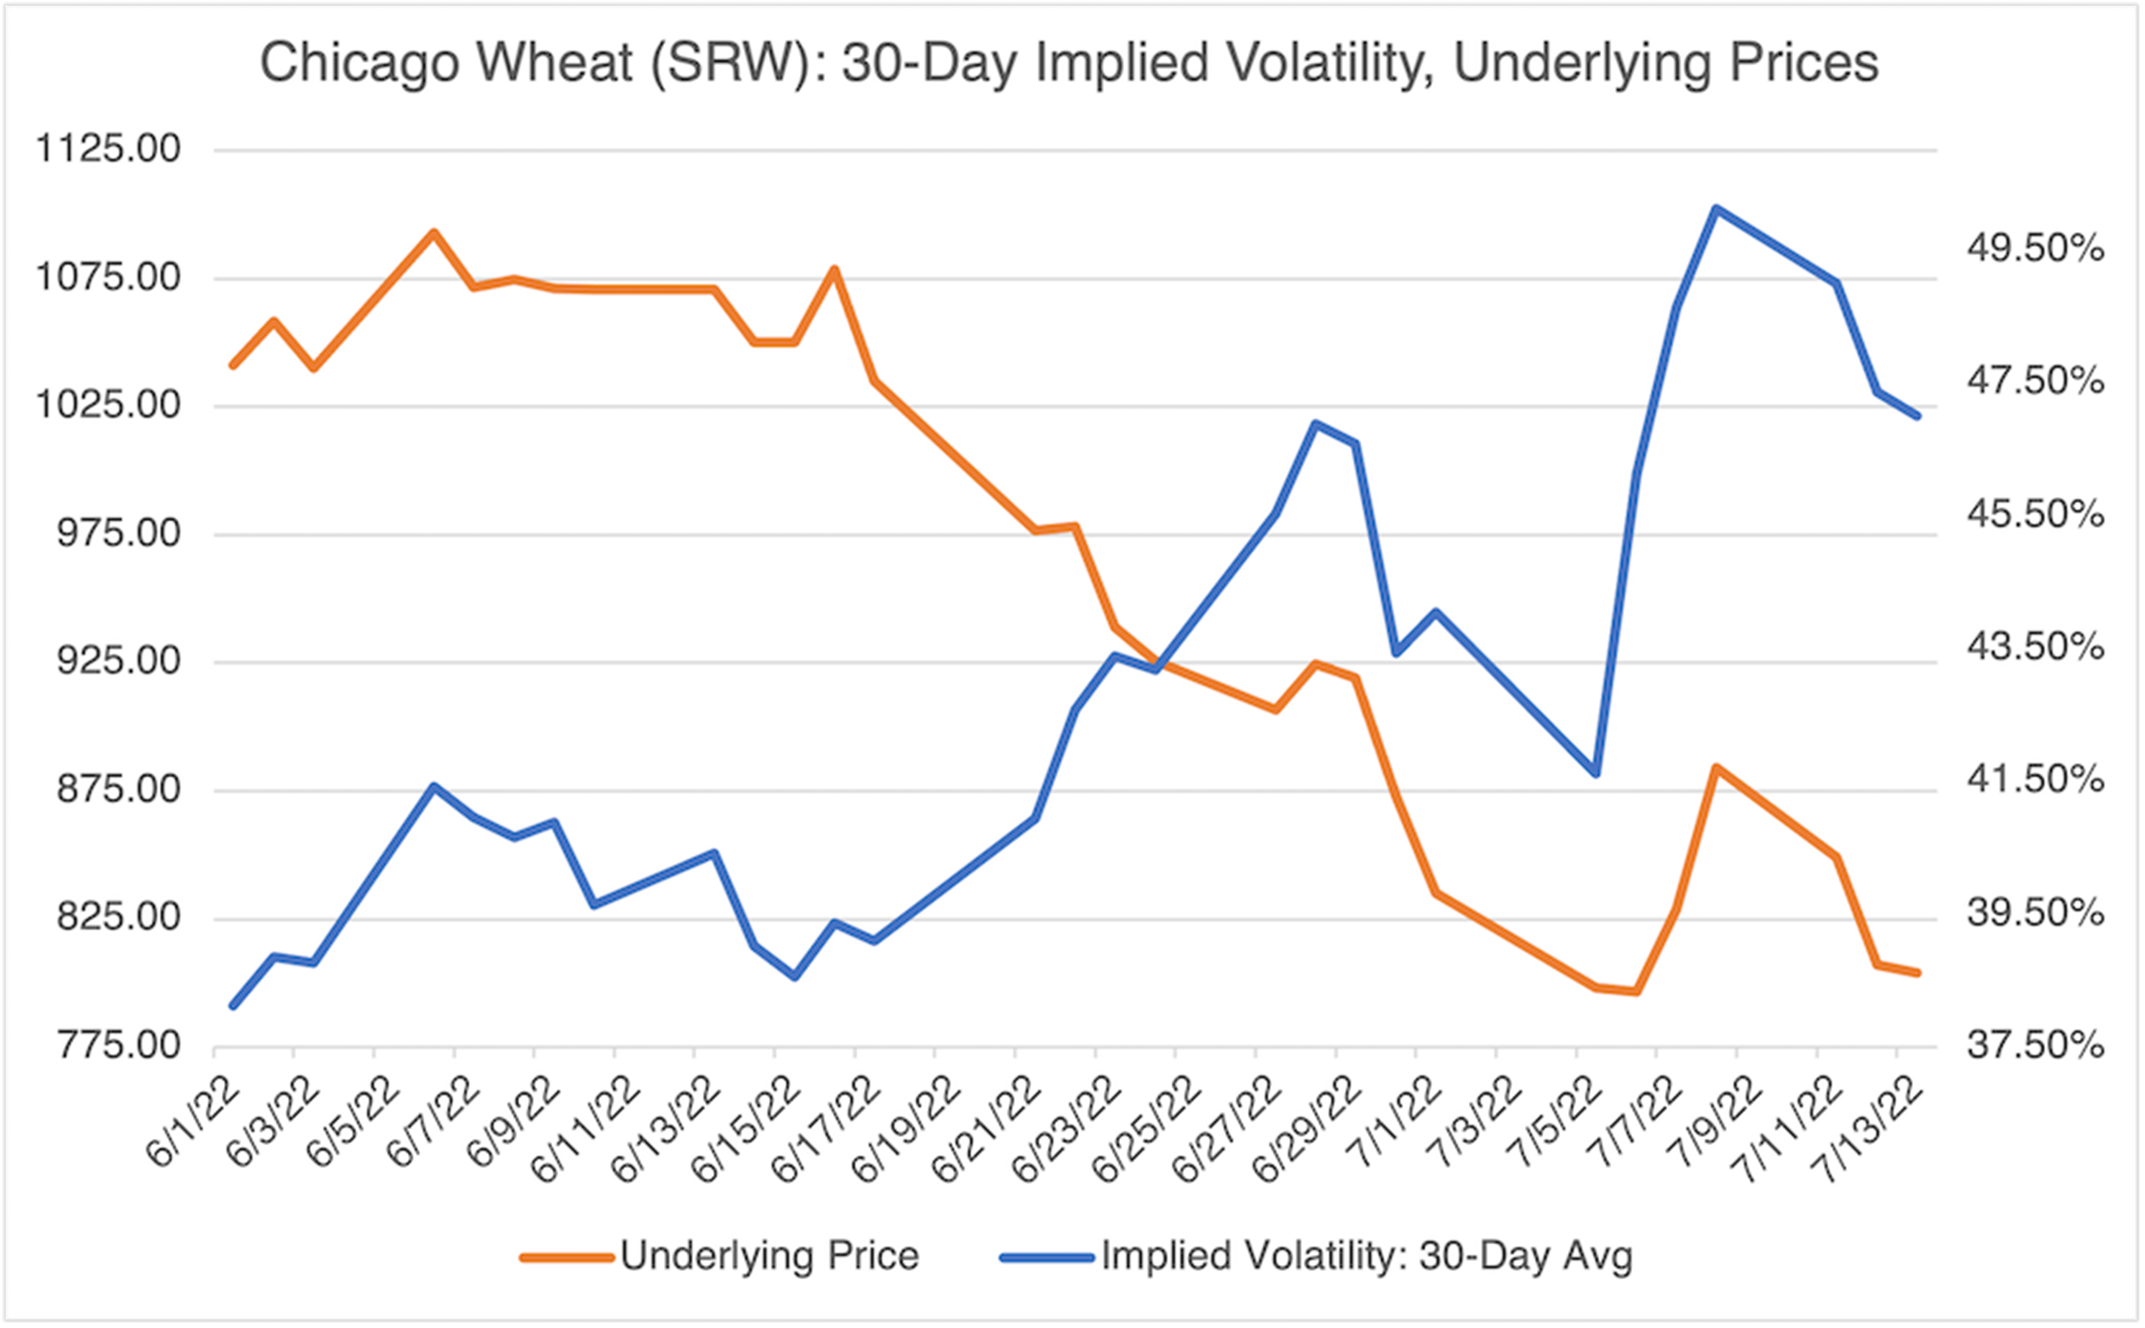
Source: OptionMetrics
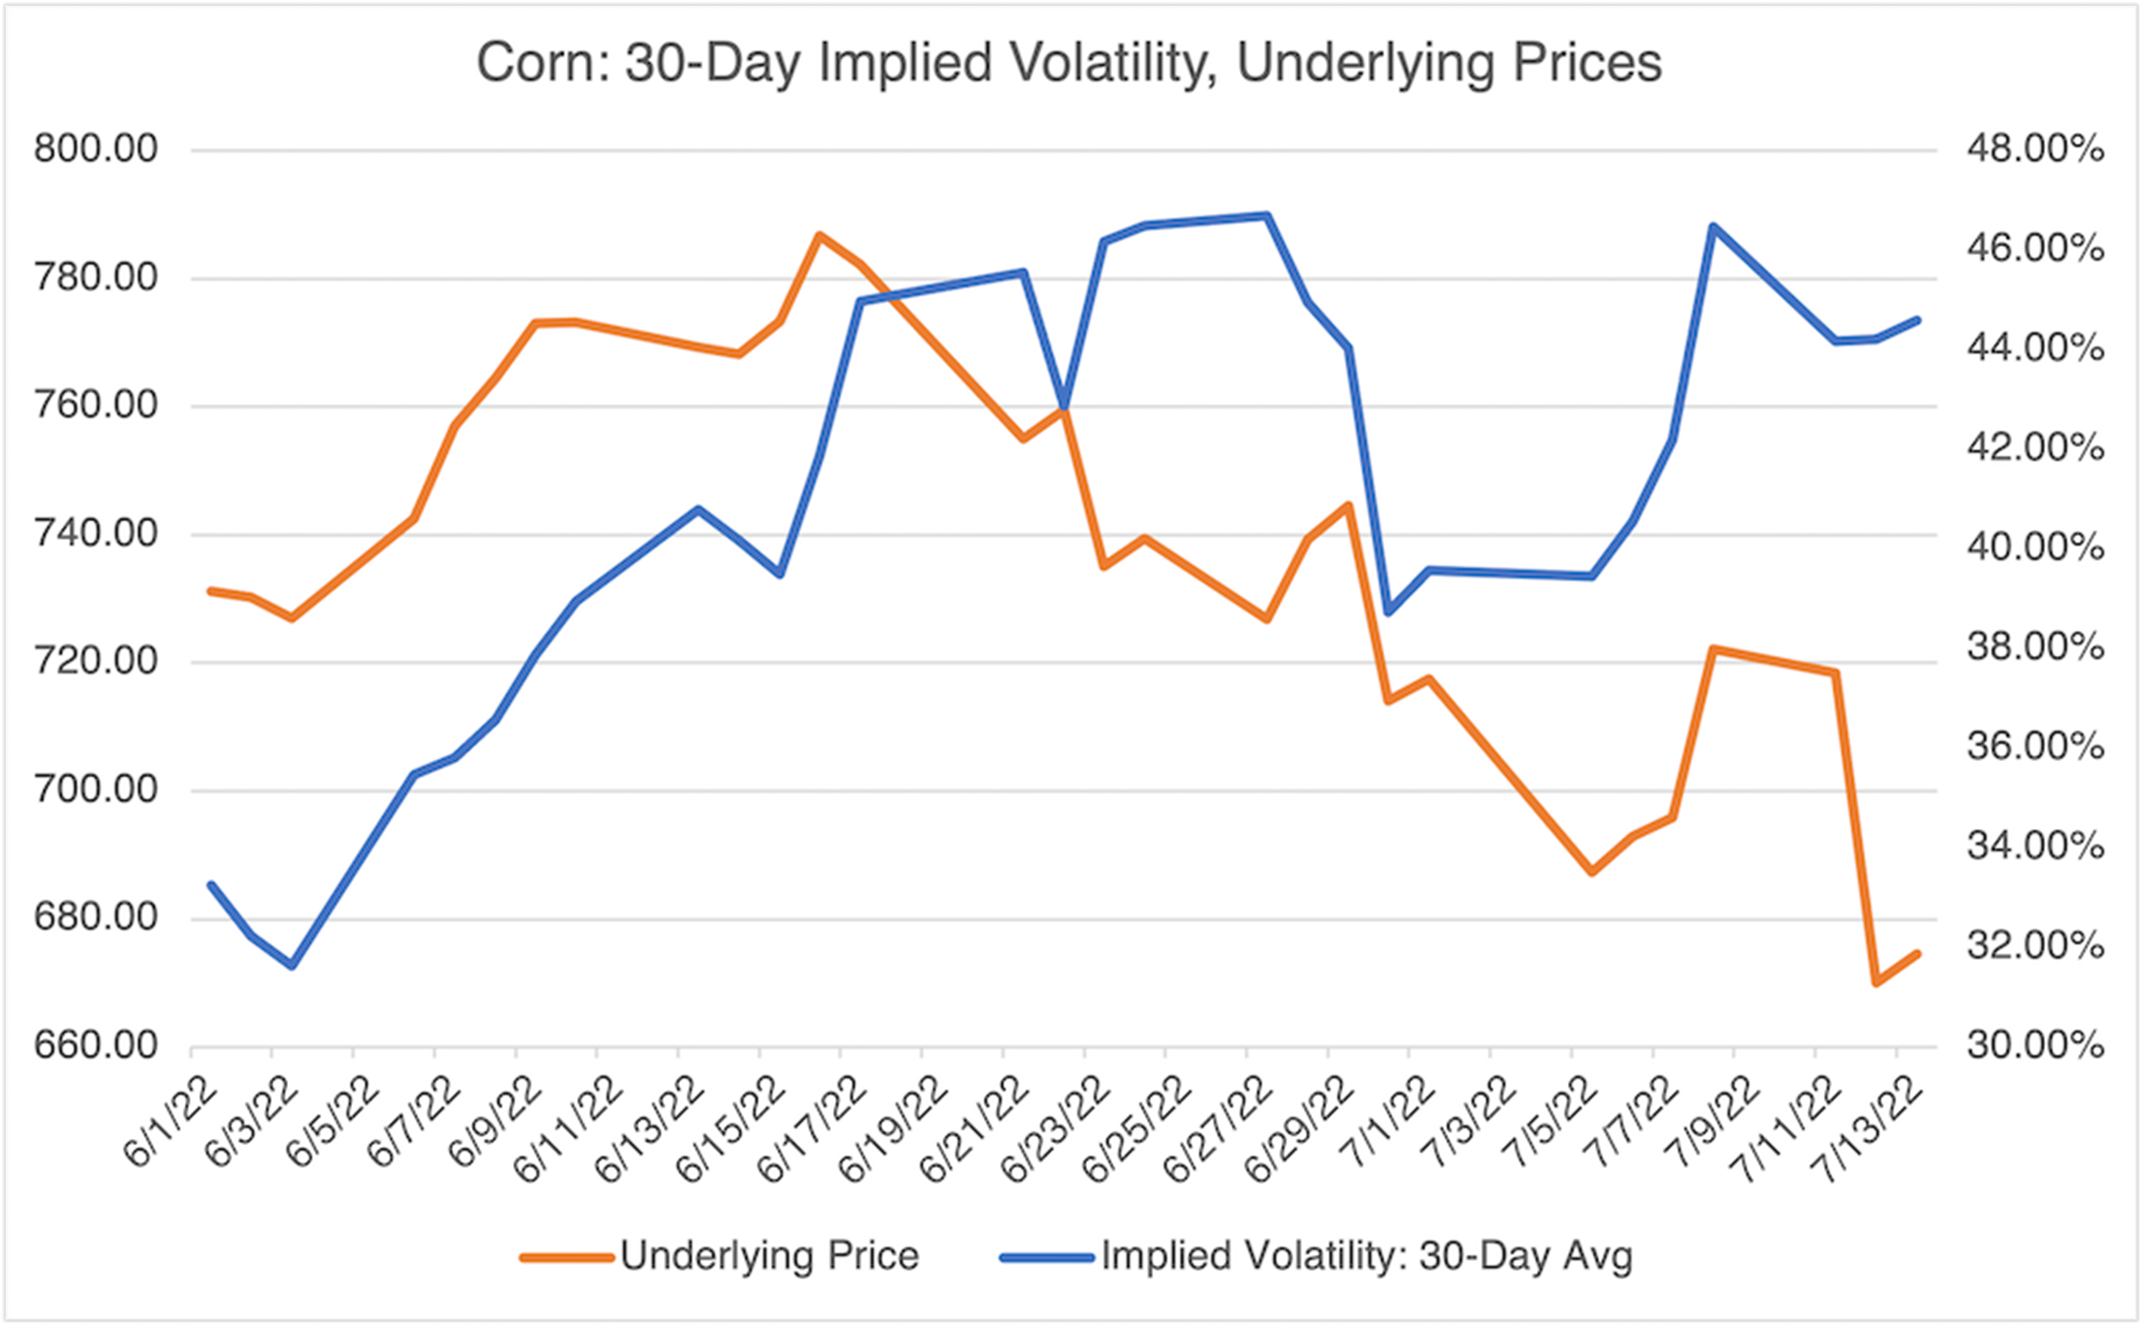
Source: OptionMetrics
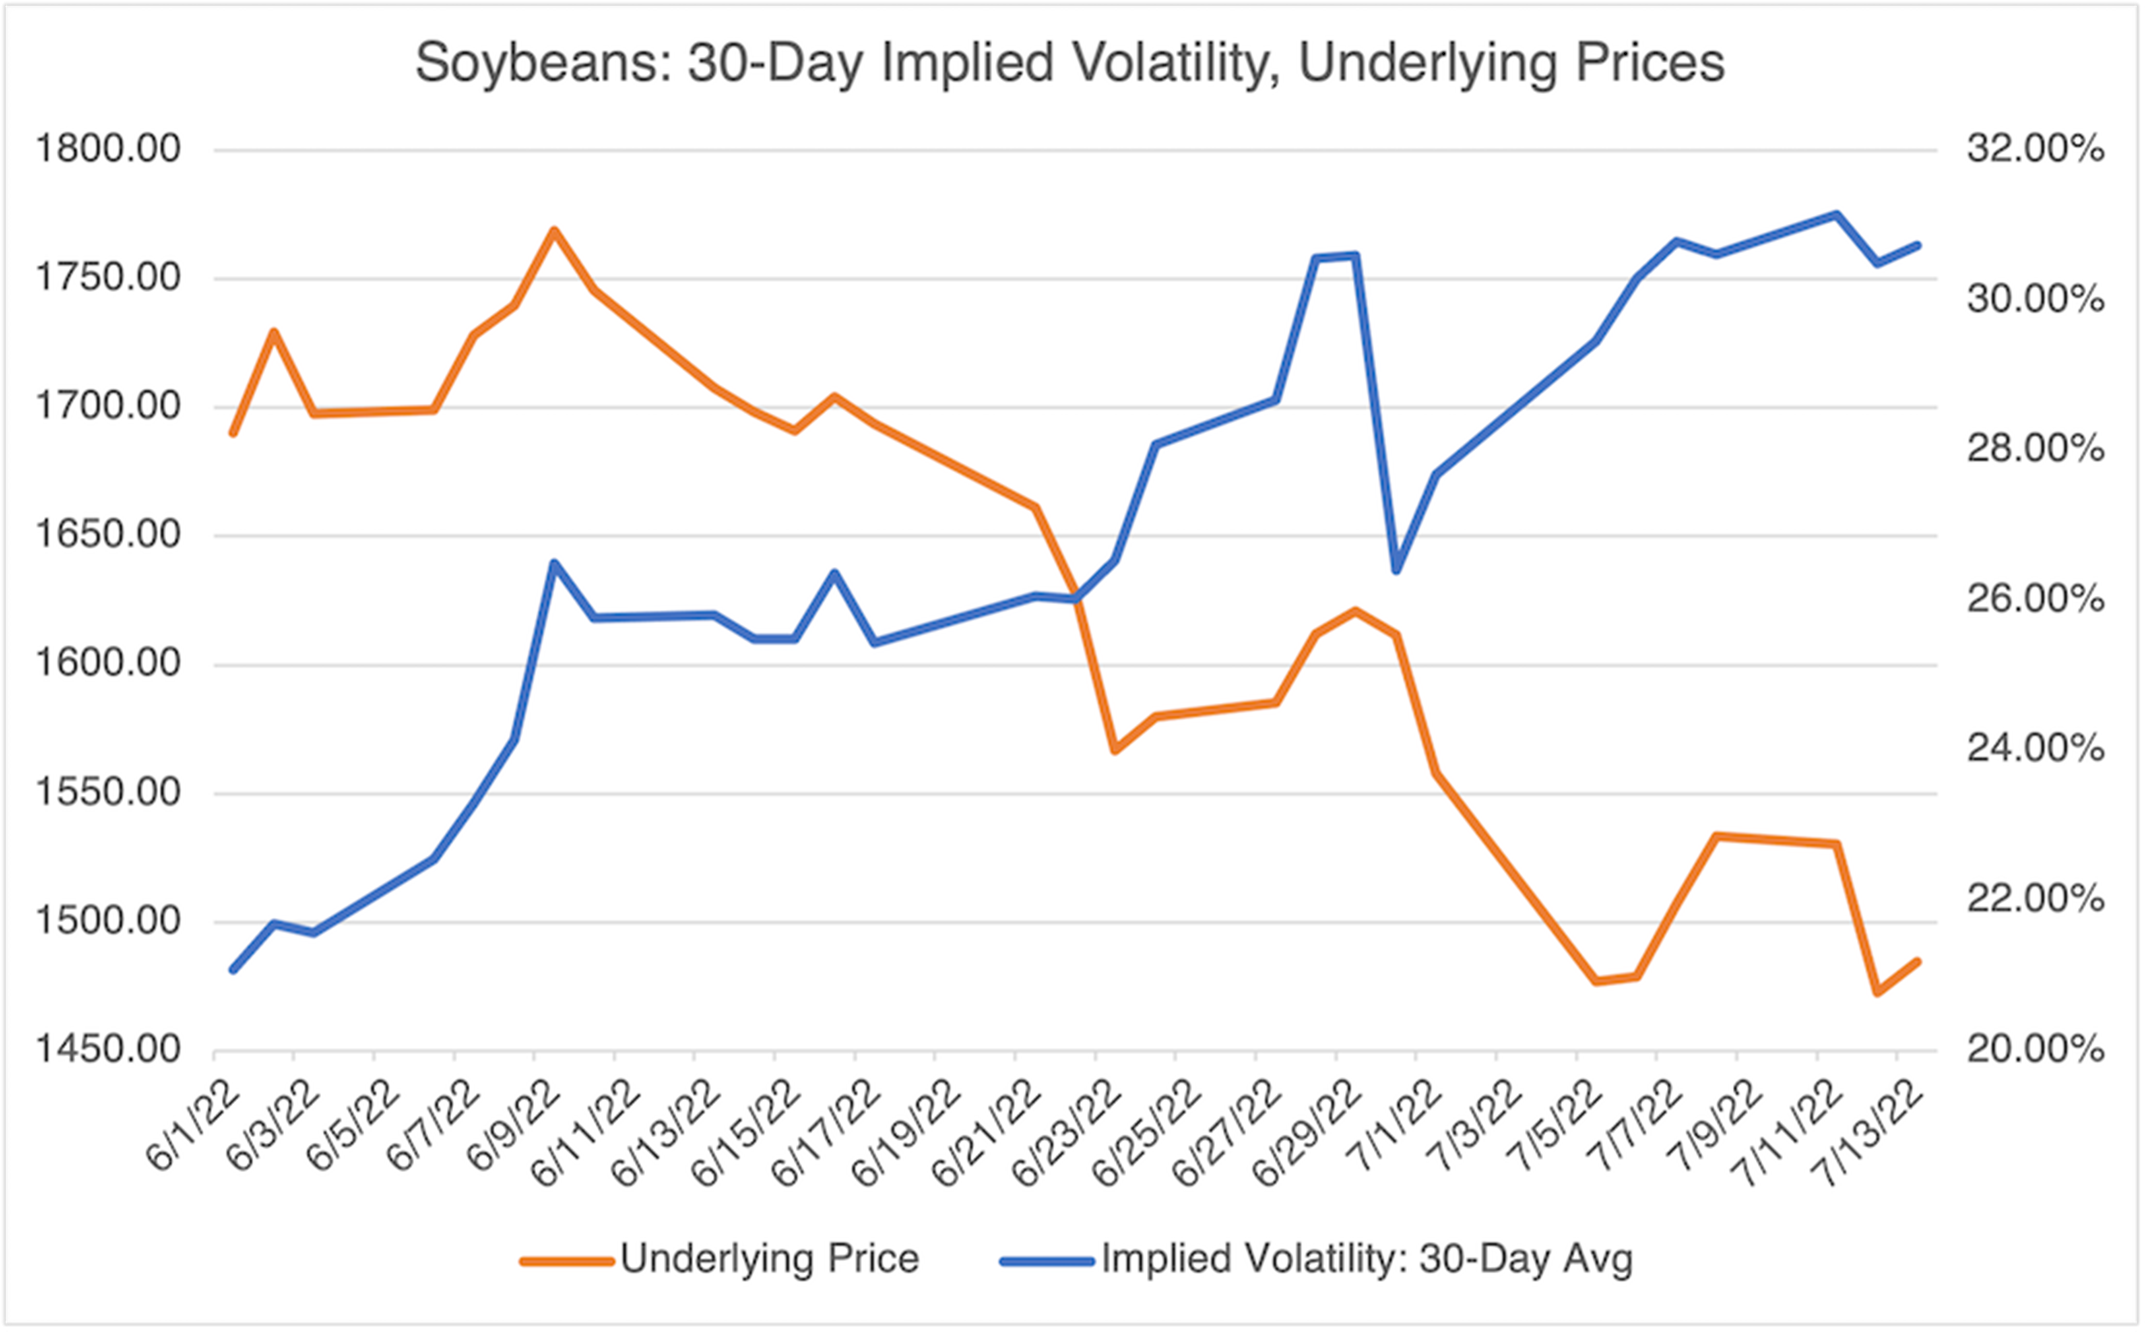
Source: OptionMetrics
Finally, lumber, a relatively obscure commodity that became the poster child for commodity price inflation at its peak last March fourth, has declined almost 37.4% since then.
Metals
Next up are metals, specifically copper, which is down over 25% since early June eighth.
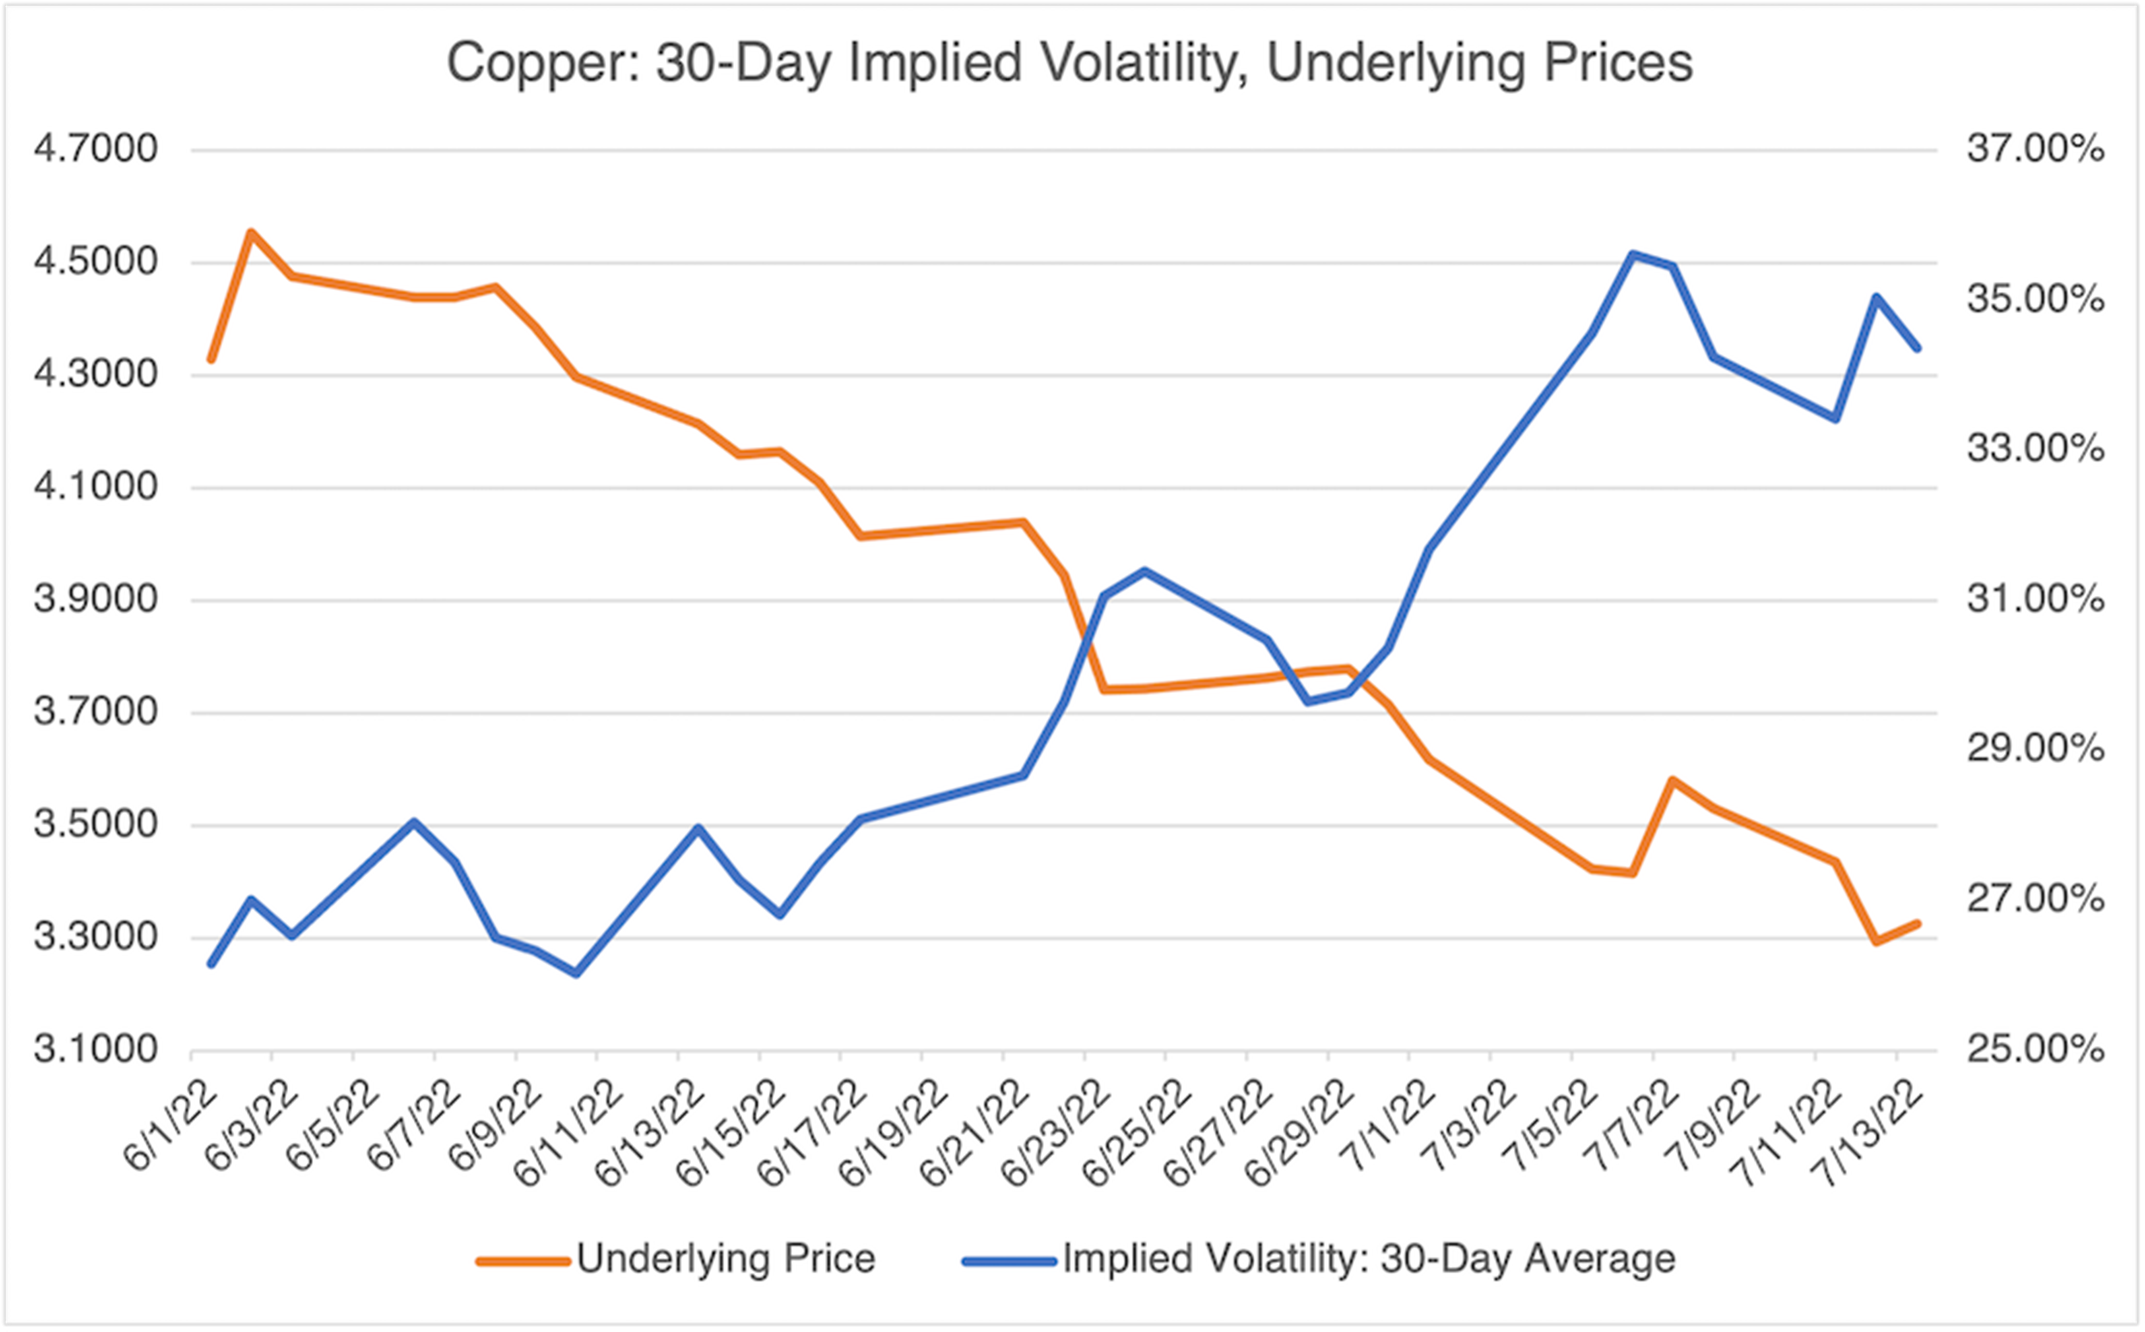
Source: OptionMetrics
FX
Finally, we have the deflationary impact of the Euro and its march towards parity with the USD:
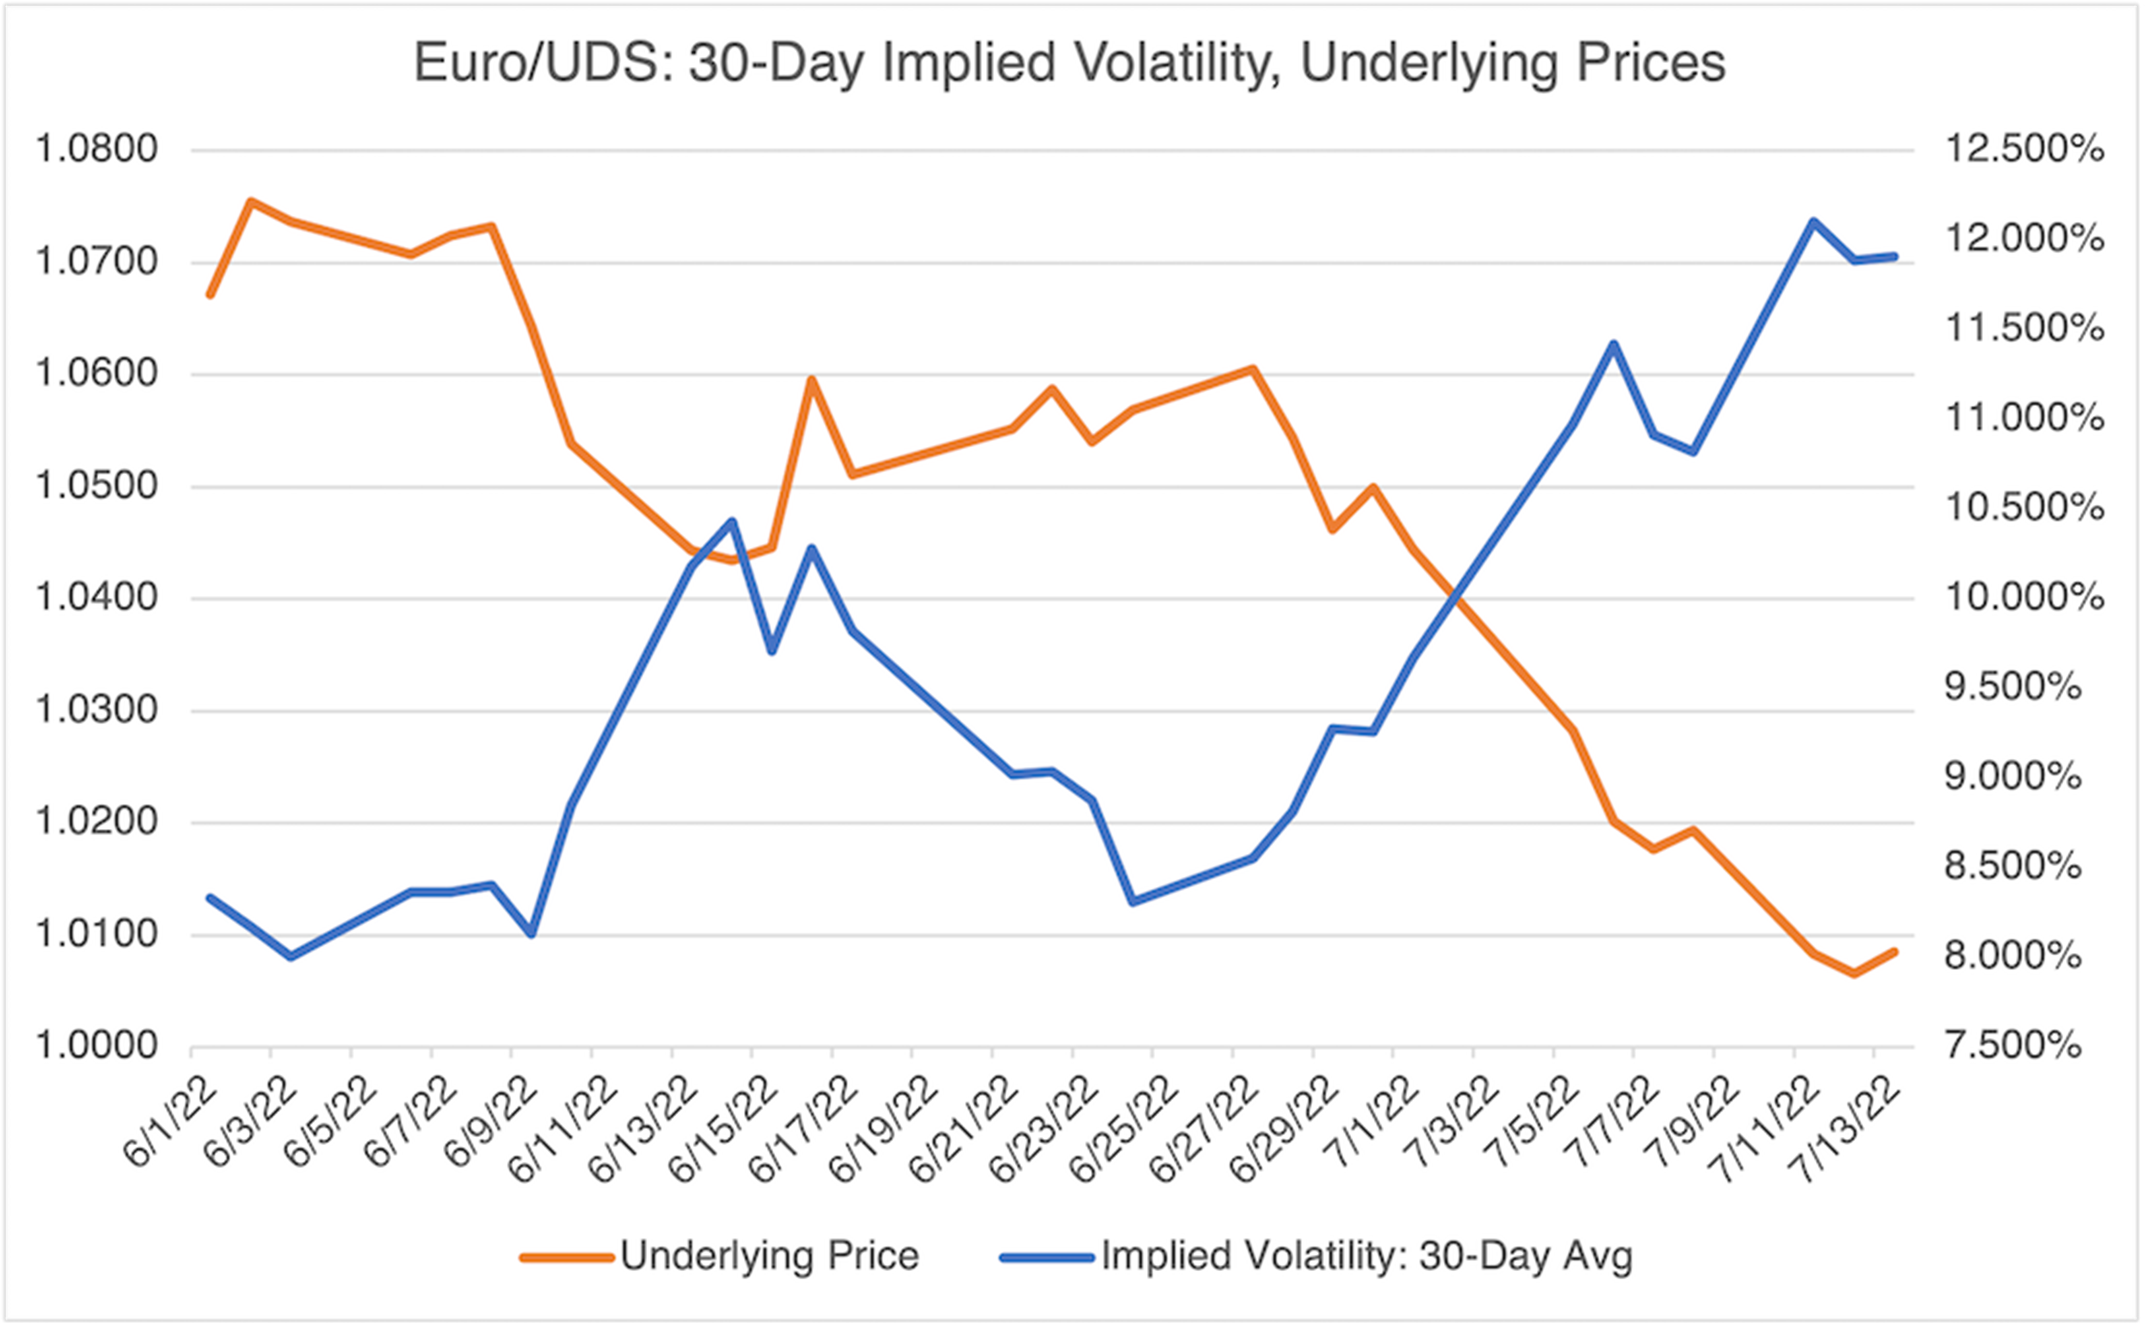
Source: OptionMetrics
Commodity prices are front and center at the Fed. “What we’re really trying to do is just get [commodity prices] to stop going up. If it leveled off…then the inflationary effects go away. We don’t need them to actually fall back down,” Fed Governor Christopher Waller said in early July. If we take Governor Waller at his word, and given the deflationary effects stemming from the commodity price declines presented above, an argument could be made against further significant rate increases.


