

It happened—the second “hammer drop” from the Federal Reserve of this rate-hiking cycle, states Mike Larson, editor of Safe Money Report.
Specifically, Chair Jay Powell and his band of monetary policymakers just hiked the benchmark federal funds rate by another 75 basis points. That was the second 0.75% increase in this cycle—an aggressive posture the likes of which we haven’t seen in decades!
I told you last week about all the ripple effects these moves are having on markets. On the dollar. On stocks. On bonds. On real estate. And more.
But what will it mean on Main Street? I think that’s easy...
Recession!
Look, one of the most reliable indicators of a future economic downturn over the years is the yield curve. The curve is simply a graphical representation of the yields on various US Treasuries with different maturity dates.
In normal, expansionary times for the economy, shorter-term Treasuries have lower yields than longer-term ones. And that makes sense.
Why? When you buy Treasuries, you’re effectively lending money to the US government. Your risk of loss from inflation or other future threats is greater when you lend for, say, ten years rather than two years.
Banks use the same logic when lending customers money to buy a car or truck over a seven or eight-year term rather than a three or four-year one. They know the risk of default is higher the longer the loan will take to mature.
But when bond investors worry about a future recession, they start making trades that flatten or “invert” the yield curve. They buy relatively more long-term bonds than short-term notes, which leads to long-term yields falling below short-term yields.
Take a look at this PowerPoint slide, which I’ll be discussing today, July 28, at the 2022 Rule Symposium in Boca Raton, FL.
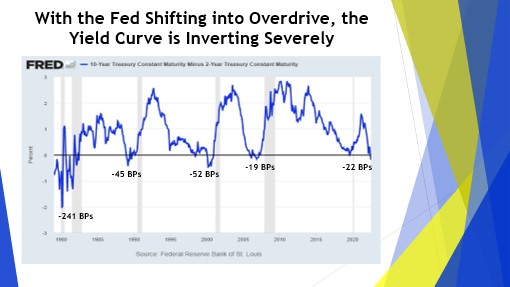
It shows the difference between the yield on the two-year Treasury Note and the yield on the ten-year Treasury Note. This so-called “2/10 spread” is one of the most common measures of the yield curve.
You can see that it has absolutely collapsed over the last 16 months—going from Positive-159 bps last March to Negative-22 bps this month.
The curve is now more inverted than it has been at any time since just before the Dot-Com crash and associated recession. And yes, that means this inversion is even worse than in the mid-2000s, just before the housing market crashed and took the stock market down with it.
This time around, we’ve already had one quarter—in Q1 2022—of negative GDP. The Q2 number hits the tape today, and there are strong indications it could also be negative.
Economic “purists” will say that two consecutive quarters of shrinking GDP doesn’t mean we’re in a recession. But that’s how many non-economists define one.
Plus, that kind of nit-picking will be cold comfort to those on Main Street, who are starting to feel the sting of a slowing economy. Jobless claims filings just hit an eight-month high, for instance, while regional manufacturing indices are falling off a cliff.
What’s more, the biggest retailer in the US, Walmart, Inc. (WMT), just warned on earnings. The company said 2022 profit could plunge as much as 13% this year, compared to a previous forecast of around 1%. For the miss, Walmart blamed strapped consumers, surging inflation, and forced markdown activity.
As an investor, you simply have to pay attention to these developments. The combination of an aggressive Fed and a looming recession is toxic for many kinds of stocks, bonds, and real estate.
It’s why I’ve been warning about aggressive growth stocks for a year now. It’s why I’ve been recommending you avoid high-risk bonds. It’s why I’ve said the best move for potential house buyers is “don’t.” And it’s why I favor “Safe Money” stocks and sectors over riskier ones.
There will come a time when the Fed is Wall Street’s “friend” again. There will come a time when the economic outlook is stronger. But this is not that time. So, don’t invest like it is!


