

A strong close with the major averages closing out their best month this year, notes Bonnie Gortler of bonniegortler.com.
All eleven S&P SPDR sectors were higher last week. Energy (XLE) and Utilities (XLU) led while Consumer Staples (XLP) and Communications Services (XLC ) lagged. The SPDR S&P 500 ETF Trust (SPY) rose by +4.28%.
S&P SPDR Sector ETFs Performance Summary 7/22/22 – 7/29/22
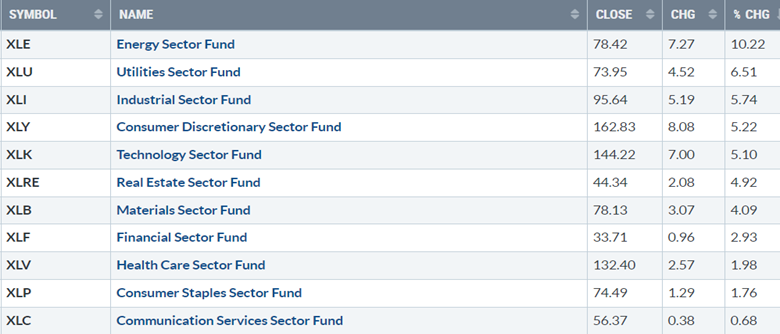
Source: Stockcharts.com
Figure 2: Bonnie's Mix of ETFs Performance Summary 7/22/22 – 7/29/22
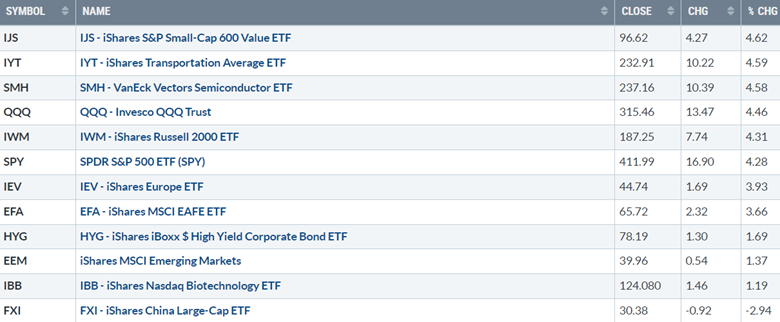
Source: Stockcharts.com
Investors were in buying mode and willing to take on risks. Small Cap Value, Transports, Semiconductors, and Technology led the advance. Buyers were in full force, bargain hunting in US Equities. However, Emerging Markets showed small gains, while China fell and was weaker than the US
Figure 3: UST 10YR Bond Yields Daily
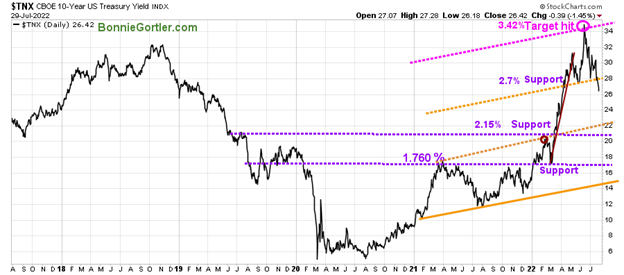
Source: Stockcharts.com
The Ten-Year US Treasury yields (TNX) continued to fall, closing at 2.642 % and below support at 2.70%. The near-term support area is between 2.15% and 2.20%
The Dow (DJI) rose +2.97%, S&P 500 (SPX) gained +4.26%, and the Nasdaq (NDX), the leading performer, rose +4.70%. The Russell 2000 Index (^RUT) rose +4.34%, while The Value Line Arithmetic Index (a mix of approximately 1700 stocks was higher by +3.96%.
Weekly market breadth was positive for the New York Stock Exchange Index (NYSE) and Nasdaq. The NYSE had 2780 advances and 728 declines, with 98 new highs and 173 new lows. There were 3383 advances and 1932 declines on the Nasdaq, with 84 new highs and 131 new lows.
Improvement in Market Breadth is Positive
Figure 4: Nasdaq Advance-Decline Line (Daily)
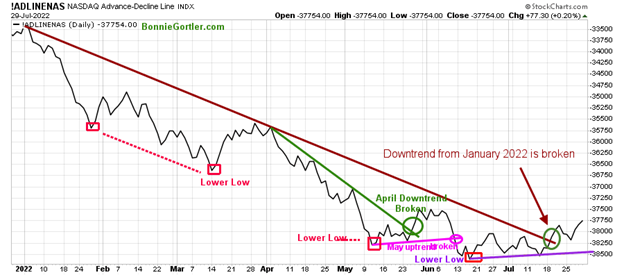
Source: Stockcharts.com
The improvement in breadth at the end of May and early June after breaking its April downtrend (green line) didn’t last for long, followed by Nasdaq weakness.
Nasdaq rose last week on positive breadth after breaking the January downtrend (brown line).
For a sustainable rally lasting for the intermediate term (weeks to months), continued strength in market breadth is needed going forward.
Figure 5: NYSE Cumulative Advance-Decline Line
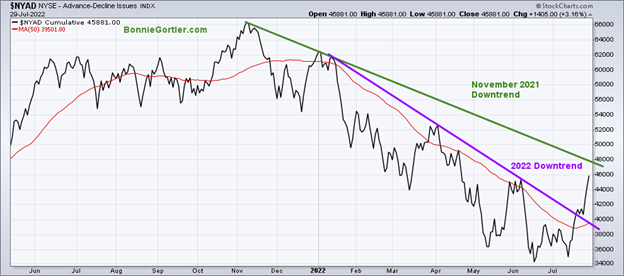
Source: Stockcharts.com
The chart above is a breadth indicator representing the cumulative difference between the number of advancing and declining stocks on the New York Stock Exchange (NYSE). Market breadth remains in a downtrend since November 2021 (green line). Further strength breaking the 2022 downtrend (green line) would be favorable.
However, there has been enough improvement to break the 2022 downtrend (purple line), implying underlying strength in the overall market.
Figure 6: CBOE Volatility Index VIX
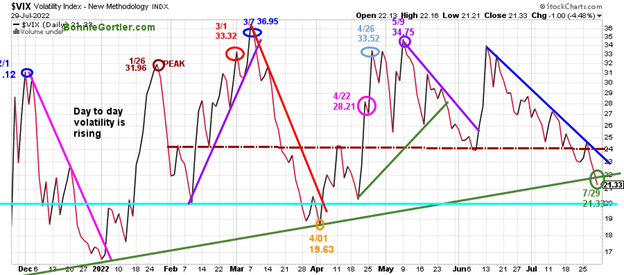
Source: Stockcharts.com
The CBOE Volatility Index (VIX), a measure of fear, has been trading above 20.00 for most of 2022. In January, VIX made a high at 31.96 on 1/26 (brown circle), on 3/1 at 33.32 (red circle), and peaked at 36.95 on 3/7 (blue circle).
VIX fell last week, closing at 21.33 (green circle getting closer to the 4/01 April low (orange circle) at 19.63.
With the rise, day-to-day volatility is likely to slow. A close above 24.00 would suggest an increase in short-term volatility,
Figure 7: Daily New York Stock Exchange (NYSE) New Lows
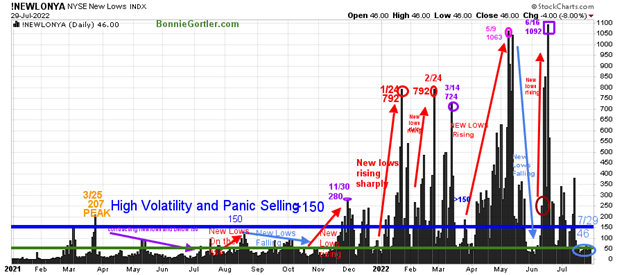
Source: Stockcharts.com
Watching new lows on the New York Stock Exchange is a simple technical tool that helps awareness of the immediate trend's direction.
New lows warned of a potential sharp pullback, high volatility, and "panic selling" for most of 2022, closing above 150. As the market started to move lower in January 2022, new lows rose sharply, peaking at 792 on 1/24 and again on 2/24 (red circles), implying an increased risk of further selling pressure.
Investors in early May unloaded stocks, and new lows expanded to 1063 on 5/9 (pink circle), then on 6/16 (purple rectangle), new lows made a new high of 1092.
Learn more about the significance of new lows Lows in my book, Journey to Wealth, published on Amazon. Here is an excerpt, "when new lows are above 150, the market is negative, higher risk, and selling is taking place. Sometimes it could be severe, and sometimes on a very nasty day, you can have 'panic selling,' and big wild swings (high volatility) to the downside may occur."
New lows remain out of the high-risk zone, above 150, closing at 46 on 7/29 (light blue circle).
It would be encouraging if new lows remained below 50, contracting to below, indicating low risk and confirmation that the short-term rally could continue.
On the other hand, it would not be favorable for new lows to increase to above 150, then I would expect weakness in the near term.
Figure 8: Daily iShares Russell 2000 (IWM) Price (Top) and 12-26-9 MACD (Middle) and Money Flow (Bottom)
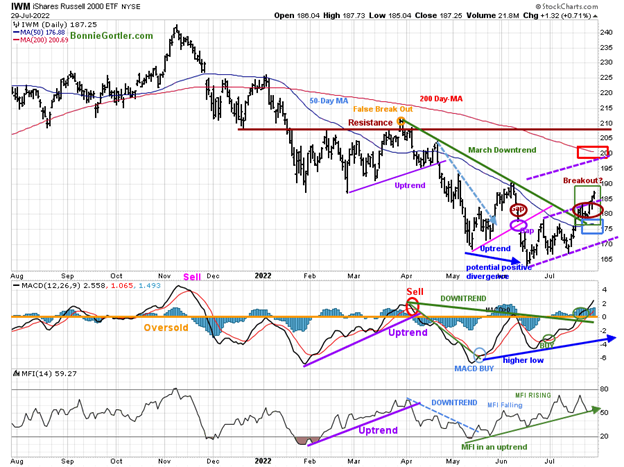
Source: Stockcharts.com
The top portion of the chart is the daily iShares Russell 2000 Index ETF (IWM), the benchmark for small-cap stocks, with a 50-Day Moving Average (MA) (blue line) and 200-Day Moving Average (MA) that traders watch and use to define trends. At the end of March, IWM failed to break out above resistance at 210.00 (orange circle), forming a downtrend (green line), broken in July.
IWM closed at 187.25, up +4.31%. Its encouraging IWM is above the 50-Day Moving Average (blue rectangle). However, more work is needed to get above the 200-Day Moving Average (red rectangle).
Short-term resistance is 190.00 and 200.00, and 210.00. Support is between 185.00 and 175.00.
Sell stops likely sit below the lows on 6/16 of 162.78 if IWM reverses, which could fuel another leg down.
MACD (middle chart) is on a buy after forming a clear positive divergence (one of my favorite patterns). It’s been a solid rally off the lows, with MACD breaking the momentum downtrend from April. For more on MACD divergences, email me, and I will send you my article MACD Made Simple.
Money Flow (lower chart) broke the April downtrend (dotted blue line) and accelerated to its highest reading since the April peak implying money was moving into small caps. Now Money Flow is falling and should be watched.
Russell 2000 IWM Weekly MACD Buy
Figure 9: Weekly iShares Russell 2000 (IWM) Price (Top) and 12-26-9 MACD (Bottom)
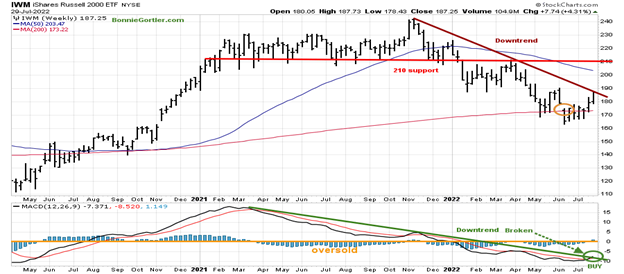
Source: Stockcharts.com
IWM closed slightly under its price downtrend from November 2021(brown line). Its favorable MACD has given a fresh buy (green circle) along with the downtrend from March 2021 broken (green line), implying the worst of the downside momentum is complete. As a result, the intermediate trend has shifted to up.
Figure 10: Daily Invesco QQQ Trust (QQQ) Price (Top) and 12-26-9 MACD (Bottom)
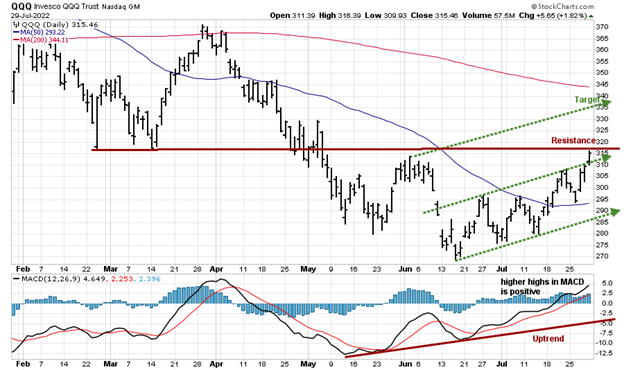
Source: Stockcharts.com
The chart shows the daily Invesco QQQ Trust (QQQ), an exchange-traded fund based on the Nasdaq 100 Index.
QQQ rose +4.46%, closing at 315.46 at short-term resistance.QQQ has a positive pattern of higher lows with a target of 335.00. Support is at 290.00 and 285.00
Sell stops are likely below the lows on 6/16 of 269.28.
Note: It’s bullish that MACD gave a new weekly buy with a break in the downtrend.
The bottom chart is MACD (12, 26, 9), a measure of momentum; MACD remains on a buy with a pattern of higher highs in an uptrend.
Figure 11: Barron’s 7/922 The Dow Jones Averages (7/8)
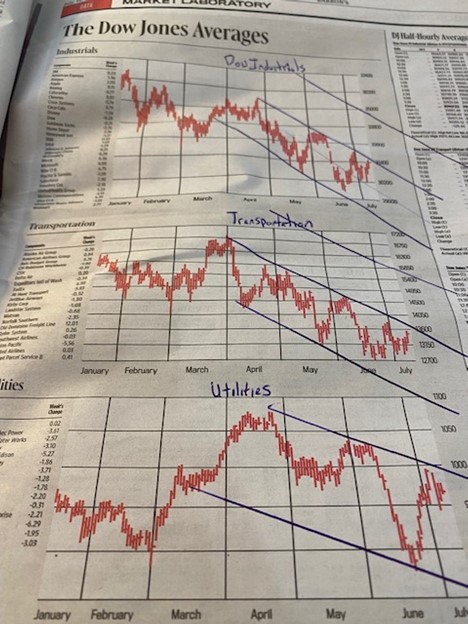
Source: Barron’s 7/9/22
Excerpt from 7/8//22 market update—above are the industrials, transportation, and utility Dow Jones Averages with trendlines using a ruler and a pen-like I did in 1982. All averages are in a downtrend. When the price closes above the downtrends, it will be easier to make money on the long side.
Figure 12: Barron’s 8/1/22 The Dow Jones Averages
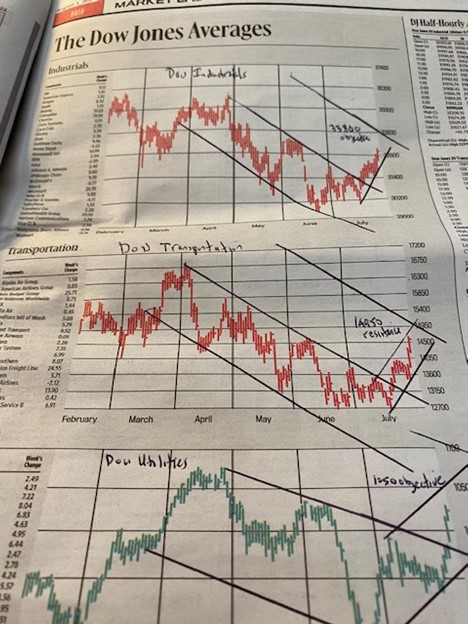
Source: Barron’s 8/1/22
What a difference a few weeks make. The short-term downtrends were all broken.
Now, the Dow Jones Averages are all in uptrends. Dow 33800 channel objective, Dow Transportation 14950 resistance, and Dow Utilities near term objective are 1050 followed by 1100.
Summing Up:
All the major averages moved higher. Concerns about earnings, recession, and interest rate rising disappeared last week. Market internals strengthened. Investors closed their shorts and bought stock. The improvement in market breadth bodes well for the overall market. Daily and intermediate momentum patterns turned positive, and downtrends penetrated. As a result, there is more room for the upside as long as market breadth is favorable, with new lows contracting and new highs expanding on the New York Stock Exchange Index and Nasdaq.
Remember to manage your risk, and your wealth will grow.
I would love to hear from you. If you have any questions or comments or would like to talk about the market, email me at Bonnie@Bonniegortler.com.
Disclaimer: Although the information is made with a sincere effort for accuracy, it is not guaranteed that the information provided is a statement of fact. Nor can we guarantee the results of following any of the recommendations made herein. Readers are encouraged to meet with their own advisors to consider the suitability of investments for their own particular situations and for determination of their own risk levels. Past performance does not guarantee any future results.


