

In June there was no question we were full on in bear market mode, and then in July, we saw a big bounce for the market, states Steve Reitmeister of Reitmeister Total Return.
The question at this critical juncture is whether it is just another bear market rally that fritters away or have we truly found a bottom with a new bull market emerging?
This is the most critical topic for all investors to grapple with at this time. And this will be the focus of this week's extended commentary. My last commentary was appropriately titled Patience Required. This was an honest assessment of the tricky nature of bear markets and where we stood at the time bouncing back from the recent lows.
However, I also knew that I would miss two weeks of commentary as my family went on an Alaskan cruise. So this was a message about patience that seemed like the appropriate topic for the days ahead.
Back to the topic at hand...
Indeed, the Market Gods are testing all of our patience as the stocks keep creeping higher and higher. So this commentary is meant to provide an honest and complete assessment of where we stand now and contingency plans for how we move forward (meaning it’s a loooooong read).
For those that want the get to the punchline. I still strongly believe that this is a bear market rally and have tons of good evidence to back this up. And that the gains so far are VERY typical of these “suckers rallies” just before dumping back down to new lows.
However, I also admit that it could be the start of the next bull. Much less likely, but still a possibility that we have to plan for...which we will.
Thus, to help me in this vital endeavor of whether to stay bearish or switch to bullish I am going beyond my typical focus on just the fundamentals to also rely upon the best market timing indicator on the planet. I am referring to the time-tested models from my friends at TheDowTheory.com.
I will share more info on that later...but spoiler alert...they see the current bounce as nothing out of the norm for a bear market. So their signals are all dead red at this moment, but not that far off from when a 50% bull signal would be sounded.
So yes, we are at a critical juncture. But after you see what I have to share you may reserve judgment on whether we should have already switched to a more bullish stance.
Because what is worse than being short during a bear market rally is switching to bullish right at the end and doubling down on your misery as the market heads lower once again. (Please read this section once more so it sinks in).
Our journey from here is to remind ourselves of the shape and complexity of past bear markets. This historical reference gives us sharper eyes to review the action in front of us.
Then we will take a walk down the fundamental lane to see what those tea leaves tell us. And then switch over to the technical views.
The sum of this will result in two paths. That being staying on our bearish game plan path for now or, if needed, a bullish contingency plan.
Bear Market History Lessons
You have often heard me say that the average bear market lasts 13 months with an average drop of 34%. Those numbers go way back to include the Great Depression.
In many ways, the functioning of that market has little resemblance to more modern times. So I decided to fish out more up-to-date stats which were plentiful in this thoughtful piece from Randy Watts in his Forbes article: Bear Market Rallies.
Here are the highlights. There have been seven bear markets in the past 50 years with an average decline of -40% over 15 months. And yes, that includes two oddly brief bear markets in 1987 and 2020. Make sure to appreciate the details in the chart below:
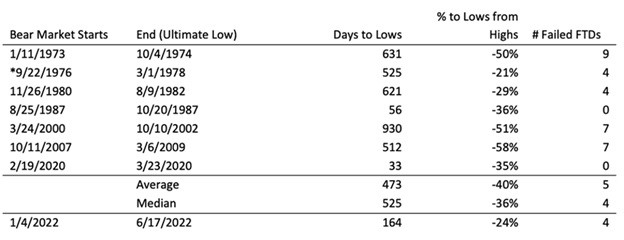
This backdrop of typical bear markets is an important setup to understand that they are typically longer-term endeavors. And that bear market rallies are common...including those the size and shape of the one we are in right now.
This next section needs a bit more set up which I will allow the author, Randy Watts, to explain himself:
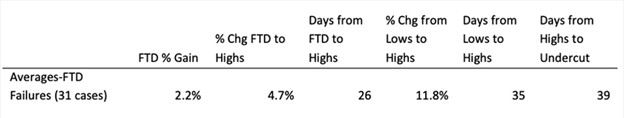
“If we examine these past bear markets, and exclude the 1987 and 2020 markets which had a V-shaped recovery (2020), or no additional undercuts of first lows (1987), we find five extended S&P 500 bear markets since 1970. These five averaged about six failed Follow Through Days (FTDs). We define an FTD as an upward move of 1.7% or greater (historically used 1.2% or greater) in the market, four days or more after a new low on an increase in day-to-day volume. The table below shows the average stats of those failed FTDs. As one can see, the typical failed FTD has an 11.8% gain over 26 days from the FTD. So, roughly a month of positive performance.”
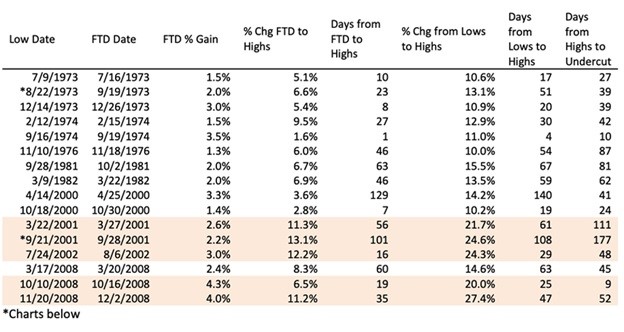
“However, there have been 16 bear market rallies after an FTD that lasted an average of 40 days. All returned over 10% and the best, five of 16, returned over 20%. Given the damage that has occurred in 2022, we think an above-average rally could be in the cards this year.”
Yes, it took me a few reads to wrap my head around this. The point is that there have been many failed “Follow Through Rallies” in history. Meaning they lasted for a while and then fizzled only for the bear market to return and new lows on the way.
The most recent rally started after the June 16 closing low of 3,666.77. From there the S&P 500 has rallied +11.6% over the past 47 days (31 days if it's only meant to be about days the market is open). Note how common the size and length of this rally is versus other failed bear market rallies before the next leg lower came to maul investors.
So yes, it is frustrating to have a bear market portfolio strategy in place while this rally happens. No doubt about it. However, at this moment there is nothing truly abnormal taking place to say that a new bull market has started. And thus could be quite dangerous to get bullish at this stage.
Now let’s move on to the...
Fundamental Picture
It is easy to paint a fundamental picture that shows the weakening of the economy and why the bear market should persist. Look no further than two straight negative GDP reports. Plus inflation is not slowing which only increases the odds of more economic pain on the way.
Honestly, the list of bearish fundamental points is nearly endless, and kind of embarrassing to even waste the keystrokes on spelling it all out (as I have spent so many keystrokes on this topic in my commentary week after week).
So for starters, I want to remind everyone of all the keystrokes and images in the section above about what a typical bear market looks like. And right now, there is nothing abnormal about this one that by the numbers is far from being over.
Instead, I think a better use of our time is tackling the bullish arguments being bandied about to show why they may be possible, but most likely untrue.
Employment is Still Strong
This is everyone’s favorite point to bring up. However, most people are not economists....because if they were they would know that employment is a lagging indicator. Often still looking good as things are going straight down the toilet. That is where we stand now. But the more inflation stays in place...the more damage is being created...the more likely that job loss is what comes next and that leads to:
Lower income > lower spending > lower corporate profits > lower share prices.
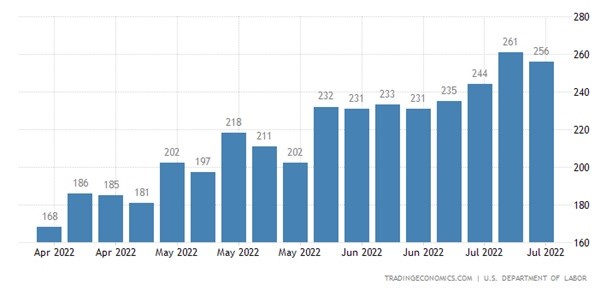
Note that weekly Jobless Claims are the most telling indicator of where monthly job gains and unemployment rate will be in the future and that is getting worse week by week as you will see in the chart below. So I believe this is the next shoe to drop to put a sword in this faux bull rally leading back to the return of the bear.
Inflation is cooling down...so Fed won’t need to raise rates as much: Yes, there were some signs of that as oil prices started to decline as well as some other key commodities as best appreciated in this commodity price index.
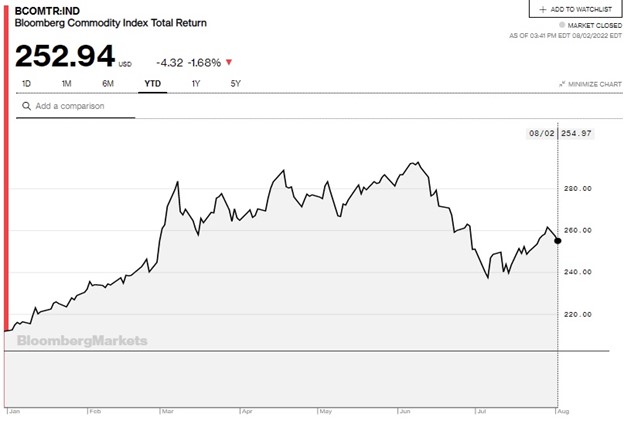
Indeed commodity prices are below the June peaks...but also 5% above the July lows. And just about every other inflation indicator is well above the 2% inflation target of the Fed. So it is more logical to expect more Fed rate hikes on the way and more damage to the economy before this bear is truly dead and buried. (And for those that want to bet on the Fed creating a soft landing note that history is not on your side).
Earnings Season Wasn’t That Bad
Actually, this is the worst earnings season since Covid, but expectations were so low that it was easy to impress. One person who is not impressed is my old friend from the Zacks years, Nick Raich. As the head of EarningsScout.com, he has stated that Wall Street analysts are still far too optimistic.
So even with earnings estimates being trimmed for coming quarters, he says they are not properly showing the earnings recession that is on the way (decline in earnings...not just slowing of growth). When that happens investors will appreciate that stocks are still overpriced. Once that is reset then we can start talking about buying the bottom.
How About This Strong Rally We Are Now Having?
This was asked and answered with our opening salvos about the traditional length of bear markets and the frequency of bear market rallies no longer or more impressive than this one.
But this topic does create a nice segue to our next topic on the Technical Picture. However, before we close the chapter on the fundamentals, I hope it is clear that bullish arguments are possible. Unfortunately, the bearish argument is much, much, much more likely given history...and given the current state of affairs with inflation running so high and the Fed outright promising more rate hikes in the months ahead.
Technical Picture
Because it is often so hard for me to see beyond the fundamentals given my economics background I have decided to lean on my good friends at TheDowTheory.com to help with a review of the technical merits of this bounce. For years that was run by a good industry friend, Jack Schannep. He is now enjoying a well-deserved retirement, but his proven indicators live on at the site.
Plain and simple, they have the best market timing track record of the primary long-term trend I have ever seen. Perfect? No. That is impossible. But in judging the primary bull/bear trend of the market there is none better.
Yesterday they published their monthly update which was easily two times longer than average (kind of like mine today;-).
To overly simplify we are not yet at the level to call a buy signal. Meaning this bounce is within the constraints of a typical bear market rally. However, we are not that far away from a 50% buy signal (not all in at 100% long..but starting a bullish bias).
The most interesting thing about their commentary yesterday is how much fundamental evidence they put out pointing out how much worse the economy is getting and why the formation of the next bull market doesn’t make a lot of sense at this time. Heck, they even made fun of themselves for this fundamental focus given their clear bias toward technical indicators. (And yes, I am laughing at myself for being a strict fundamental adherent...and yet spending so much time on price action and technicals in today’s conversation.)
However, if the #s tell them to get bullish...no matter the fundamentals...then we need to play ball as well and will start shifting from net short to net long. Note that they often have false buying signals that are then followed by a return of the bear market. But even with that being true there is enough upside in those signals to get long and then retreat into a short position if needed.
Reity, stop beating around the bush...what are the signals to get more bullish?
Got two answers for that.
First and most important, they are proprietary indicators reserved for subscribers of TheDowTheory.com, and thus would be unethical for me to share the specifics. Rest assured I am checking every day and will not delay in getting more bullish in Reitmeister Total Return portfolio if need be.
Secondly, there are many parts to the signal. Not just the S&P 500 (SPX), but also need confirmation from the Dow (DJI) and Dow Transportation indices (DTX). But for simplicity let's say we are relatively 2% below that 50% buy signal. And those levels relatively correspond with the highs made in May before the final dive into bear market territory in June.
Putting It Altogether
This is by far the longest commentary I have ever put written. Bar none.
However, it is well deserved given the time off for my vacation and the, no doubt great frustration you have endured as the market has ticked higher for the better part of the last six weeks.
I hope you appreciate the importance of starting with the historical bear market backdrop as a form of truth serum for evaluating current market conditions. Then add on top the fundamental and technical discussion to show why continuance of the bear market, and our strategies, is the most logical choice at this time.
However, as you know I am a strong believer in learning lessons from the past and adjusting. Especially lessons that cost me money and don’t want to repeat.
That is why I am adding the technical layer to our strategies to make sure if indeed a new bull is in the offing that we are not on the wrong side of the markets for too long. Hopefully, that will not be necessary, but I will not be shy to pull the trigger to switch to a more bullish posture if and when the time comes.
Now let the chips fall where they may.
Portfolio Update
Let’s take a pass on this section today. No need to bludgeon ourselves with the gory details of the past few weeks. However, I would be remiss if I didn’t remind everybody of the longer-term realities of the outperformance enjoyed by RTR members.
Here is the full 2022 year-to-date picture
-14.16% S&P 500 (SPX)
-11.66% RTR (yes, we once had a much bigger edge including a gain while the bear market unfolded...but even now at our worst moment of the year we are still ahead).
And since we started tracking performance on 6/11/21
+36.28% S&P 500
+49.06% RTR
I hope today’s insights help you make the right decisions for your portfolio as the quite-odd market year of 2022 continues to unfold.


