

Stocks have continued to rally from the June lows, with the rally picking up steam over the last three or four weeks, says Lawrence McMillan of Option Strategist
Now the S&P 500 (SPX) has run into the heavy resistance area of 4070-4170, which was initially established back in the early part of June. A clear breakout over 4170 would be bullish and would likely then call for a challenge of the bear market downtrend line at 4300+.
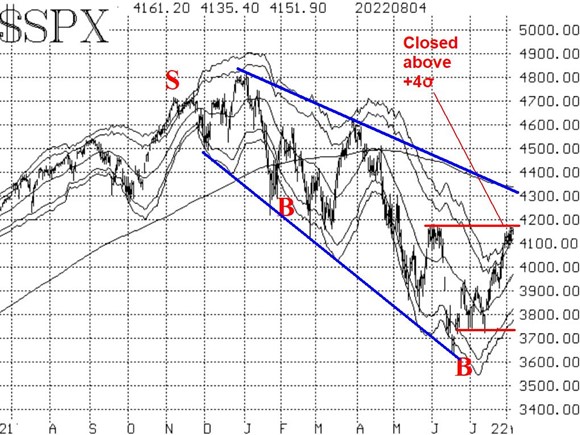
However, there is no guarantee that this will occur. A failure at this same level (4170), among growing overbought conditions, could lead to a resumption of the downtrend. A break back down below 4070 would be a bearish signal.
The larger trend, as noted by the blue lines on the SPX chart in figure one, is still bearish at this time. However, large bear market rallies are common, and this one could have further to go.
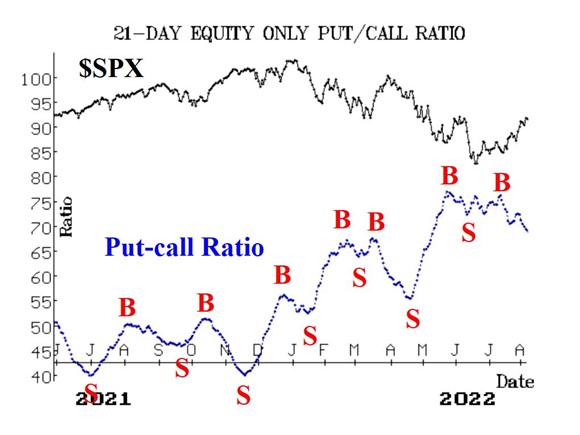
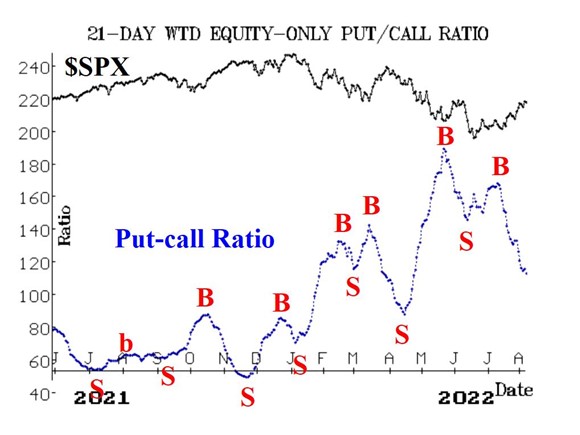
Equity-only put-call ratios remain on buy signals as they are declining steadily. The weighted ratio is declining at a greater rate and is more than halfway down its chart already. The standard ratio is making new relative lows for this move but has not declined as much as the weighted ratio. These will remain bullish indicators for stocks as long as they are declining.
Market breadth has been strong of late as well, and both breadth oscillators remain on buy signals. For the most part, NYSE breadth has been stronger than "stocks only" breadth, although that was not the case yesterday. These oscillators are in overbought territory, and they could withstand a couple of days of negative breadth without rolling over to sell signals.
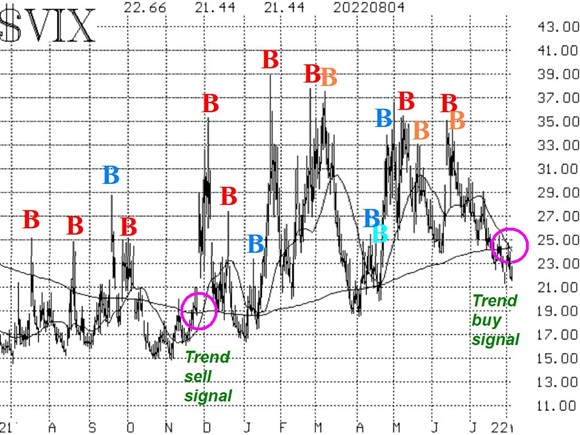
The COBE Volatility Index (VIX) has continued to decline, and now a significant change of trend buy signal has occurred. Both VIX and its 20-day Moving Average are below the 200-day Moving Average. That is the definition of a downtrend in VIX, and a downtrending VIX is bullish for the stock market. From figure four, you can see that the previous trend sell signal occurred late last November. That was certainly a good intermediate-term signal since $SPX is much lower now than it was then. But now, the trend of $VIX has reversed downward.
To summarize, if SPX closes above 4170 for two consecutive days, we will abandon our "core" bearish thesis—at least for the time being. Meanwhile, we will continue to trade the short-term indicators when they generate confirmed signals


