

In 2020 and 2021, we published a very well-received series of articles related to a longer-term pattern we called the Excess Phase Peak pattern, states Chris Vermeulen of TheTechTraders.
At that time, we highlighted the five components of the Excess Phase Peak pattern and provided several examples showing how it usually played out for traders.
You can review our first article: How To Spot The End Of An Excess Phase.
One more article to review is Revisiting The Excess Phase Peak Pattern, which contains links to many of our previous Excess Phase articles. We received so many comments and emails from this article that we thought now would be a great time to bring it forward once more. It highlights how the S&P 500 ETF Trust (SPY) appears to be moving into a Stage Four Excess Phase Peak pattern again. Recently we’ve seen the SPY move through phases one, two, and three. Now, we need to see if the next breakdown in price will start or confirm the phase four price breach.
Why Is the Excess Phase Peak Important?
The Excess Phase Peak pattern is a very common transitional phase for the markets where psychology and economic trends shift over time. Global markets typically require periods of pause, reversion, or a reset/revaluation event to wash away excesses. We’ve seen these types of setups happen near the Dot Com and 2007-08 market peaks. What happens is traders are slow to catch onto the shifting phases of the Excess Phase Peak and sometimes get trapped thinking, “this is the bottom—time to buy.”
The reality is that as long as the individual phases of the Excess Phase Peak continue to validate (or confirm), then we should continue to expect the next phase to execute as well. In other words, unless the Excess Phase Peak pattern is invalidated somehow, it is very likely to continue to execute, resulting in an ultimate bottom in price many months from now.
The Five Phases of the Excess Phase Peak Pattern
The Excess Phase Peak Patterns off in a very strong rally phase. This rally phase normally lasts well over 12 to 24 months and is usually driven by an extreme speculative phase in the markets.
Once a price peak is reached and the markets roll downward by more than 7~10%, that’s when we should start to apply the five unique phases of the Excess Phase Peak Pattern. If each subsequent phase validates after the peak, then the Excess Phase Peak Pattern is continuing. If any phase is invalidated, then the pattern has likely ended. For example, if we start by completing phases one and two, then the market rallies to a new all-time high—that would invalidate the Excess Phase Peak Pattern.
Here are the Phases of the Excess Phase Peak Pattern:
- The Excess Phase Rally Peak.
- A breakdown from the Excess Phase Peak sets up a FLAG/Pennant recovery phase.
- Sets up the Intermediate support level—the last line of defense for price.
- Price retests number three support and breaches the support level—starting a new downtrend.
- The final breakdown of the price is below the phase four support level. This usually starts a broad market selling phase to an ultimate bottom.
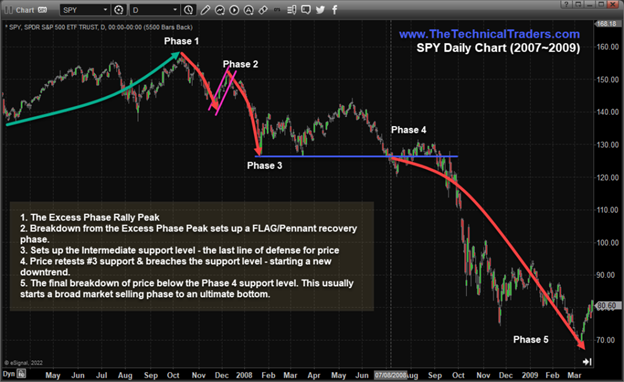
Now, let’s take a look at the 2007-09 SPY market peak to see how these phases played out.
2007-2009 Excess Phase Peak Pattern
As highlighted in the chart below, phases one and two played out perfectly, with a lower high for phase two and a phase three breakdown. By the time phase two broke downward, we should have been keenly aware of the potential for a phase three support level to set up and extend.
Phase three can sometimes result in an upward-sloping support channel (like a Bear Flag), but in this case, it is validated as a horizontal support level. We could have used the May 2008 peak as a reversal/breakdown trigger showing us an early phase three change in trend. Having said that, until the phase three support level is breached—these could turn into false breakdowns.
Once phase three support is breached, and we start a deeper downward price trend (moving into the phase four search for the ultimate bottom), traders need to stay very cautious of risks. Phase three is one of the most troubling and difficult phases to navigate. It always seems like a “perfect new bottom in price”—until phase four hits.
Ultimately, a phase five bottom sets up (the ultimate bottom), and this usually coincides with extreme selling pressures. Often, the US or foreign governments are involved in trying to contain global risks or address global corporate/financial concerns. We must wait for confirmation of a bottom before really taking advantage of the lower price levels—but this can be accomplished using technical indicators and price theory.
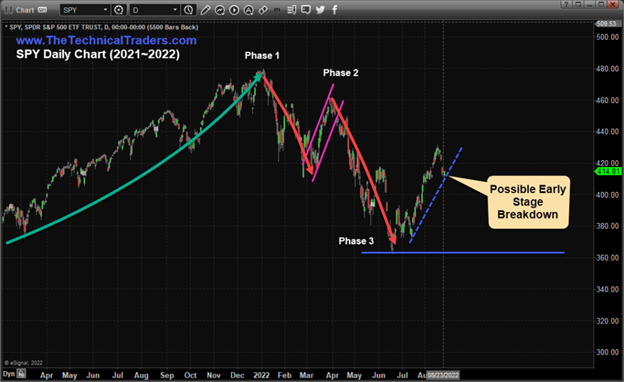
The Current 2022 Excess Phase Peak Pattern Setup
On the chart below, I estimate we are in the midst of an early phase three potential reversal setup. We’ve already seen a very clear phase one peak, a -13.80% downtrend setting up the phase two bullish Flag/Pennant trend. Then we watch as the phase two breakdown took place, resulting in another -21.60% price decline. Those lows set up the current phase three base/support level near $363.
I’m cautiously watching the blue-dashed trend line as a potential early warning trigger for the phase three bullish recovery cycle. Usually, within a phase three recovery, after establishing critical support, the rally phase becomes very important to validate/confirm the potential phase four and five processes.
If the Excess Phase Peak Pattern is going to invalidate at this point, the critical support level will stay unbroken, and a new upward price trend will be established from the phase three support/bottom. So, this is when we need to watch very cautiously for any significant shift in central bank policies, foreign capital risks, shifting sentiment, or anything else that may provide the needed support for the markets to keep rallying higher. Otherwise, we should expect the Excess Phase Peak to continue unfolding.
In Conclusion
Traders and Investors should stay very cautious in this phase of the markets. Going “all-in” with a bullish or bearish expectation right now can be very dangerous to your bottom line.
Learn why I rely on my proprietary CGS, BAN, and TTI strategies to assist in identifying opportunities in various market trends and how I use these to find opportunities to trade within the Excess Phase Peak Pattern. Volatility is still quite high, and there are opportunities for great trades if you understand risk factors.
Learn From Our Team of Seasoned Traders
In today’s market environment, it’s imperative to assess our trading plans, portfolio holdings, and cash reserves. As professional technical traders, we always follow the price. At first glance, this seems straightforward. But emotions can interfere with a trader’s success when they buck the trend (price). Remember, our ego aside, protecting our hard-earned capital is essential to our survival and success.
Successfully managing our drawdowns ensures our trading success. The larger the loss, the more difficult it will be to make up. Consider the following:
- A loss of 10% requires an 11% gain to recover.
- A 50% loss requires a 100% gain to recover.
- A 60% loss requires an even more daunting 150% gain to simply break even.
Recovery time also varies significantly depending upon the magnitude of the drawdown:
- A 10% drawdown can typically be recovered in weeks to a few months.
- A 50% drawdown may take many years to recover.
Depending on a trader’s age, they may not have the time to wait nor the patience for a market recovery. Successful traders know it’s critical to keep drawdowns with reason, as most have learned this principle the hard way.


