

As investors and traders gear up for September, most expect a bumpy ride, states Lucas Downey of Mapsignals.com.
History proves it’s a red month on average. That’s the bad news. The good news is that Q4 tends to be a great time for stocks. And when it’s a midterm election year, returns are even better.
Here’s your midterm election stock market playbook.
If you’re scratching your head about the stock market’s next move, you’re not alone. The macro landscape is murky, to say the least. Investors and traders are dealing with elevated energy prices, war, high inflation, and an unclear earnings outlook for stocks.
Add to the mix a midterm election year, and you’ve got a recipe for heightened volatility.
But I bring good news! There are historical patterns that tend to play out for markets during midterm election years. More importantly, investors can better position their portfolios by turning to data and history for clues.
Today we’ll take a ride through market history looking at monthly stock performance. Then we’ll zero in on prior midterm election years. This will likely shed light on what’s in store for 2022. Odds are this information will equip you for the months ahead.
Midterm Election Stock Market Playbook
As we get closer to the midterm election in November, now’s the time to get a game plan.
To start, let’s understand seasonal patterns in stocks. Going back to 1990, September tends to be bumpy, while October through December is jumpy.
As you can see below, the S&P 500 (SPX) averages a -.5% return in September, while October, November, and December gain +1.4%, +1.8%, and +1.5% respectively:
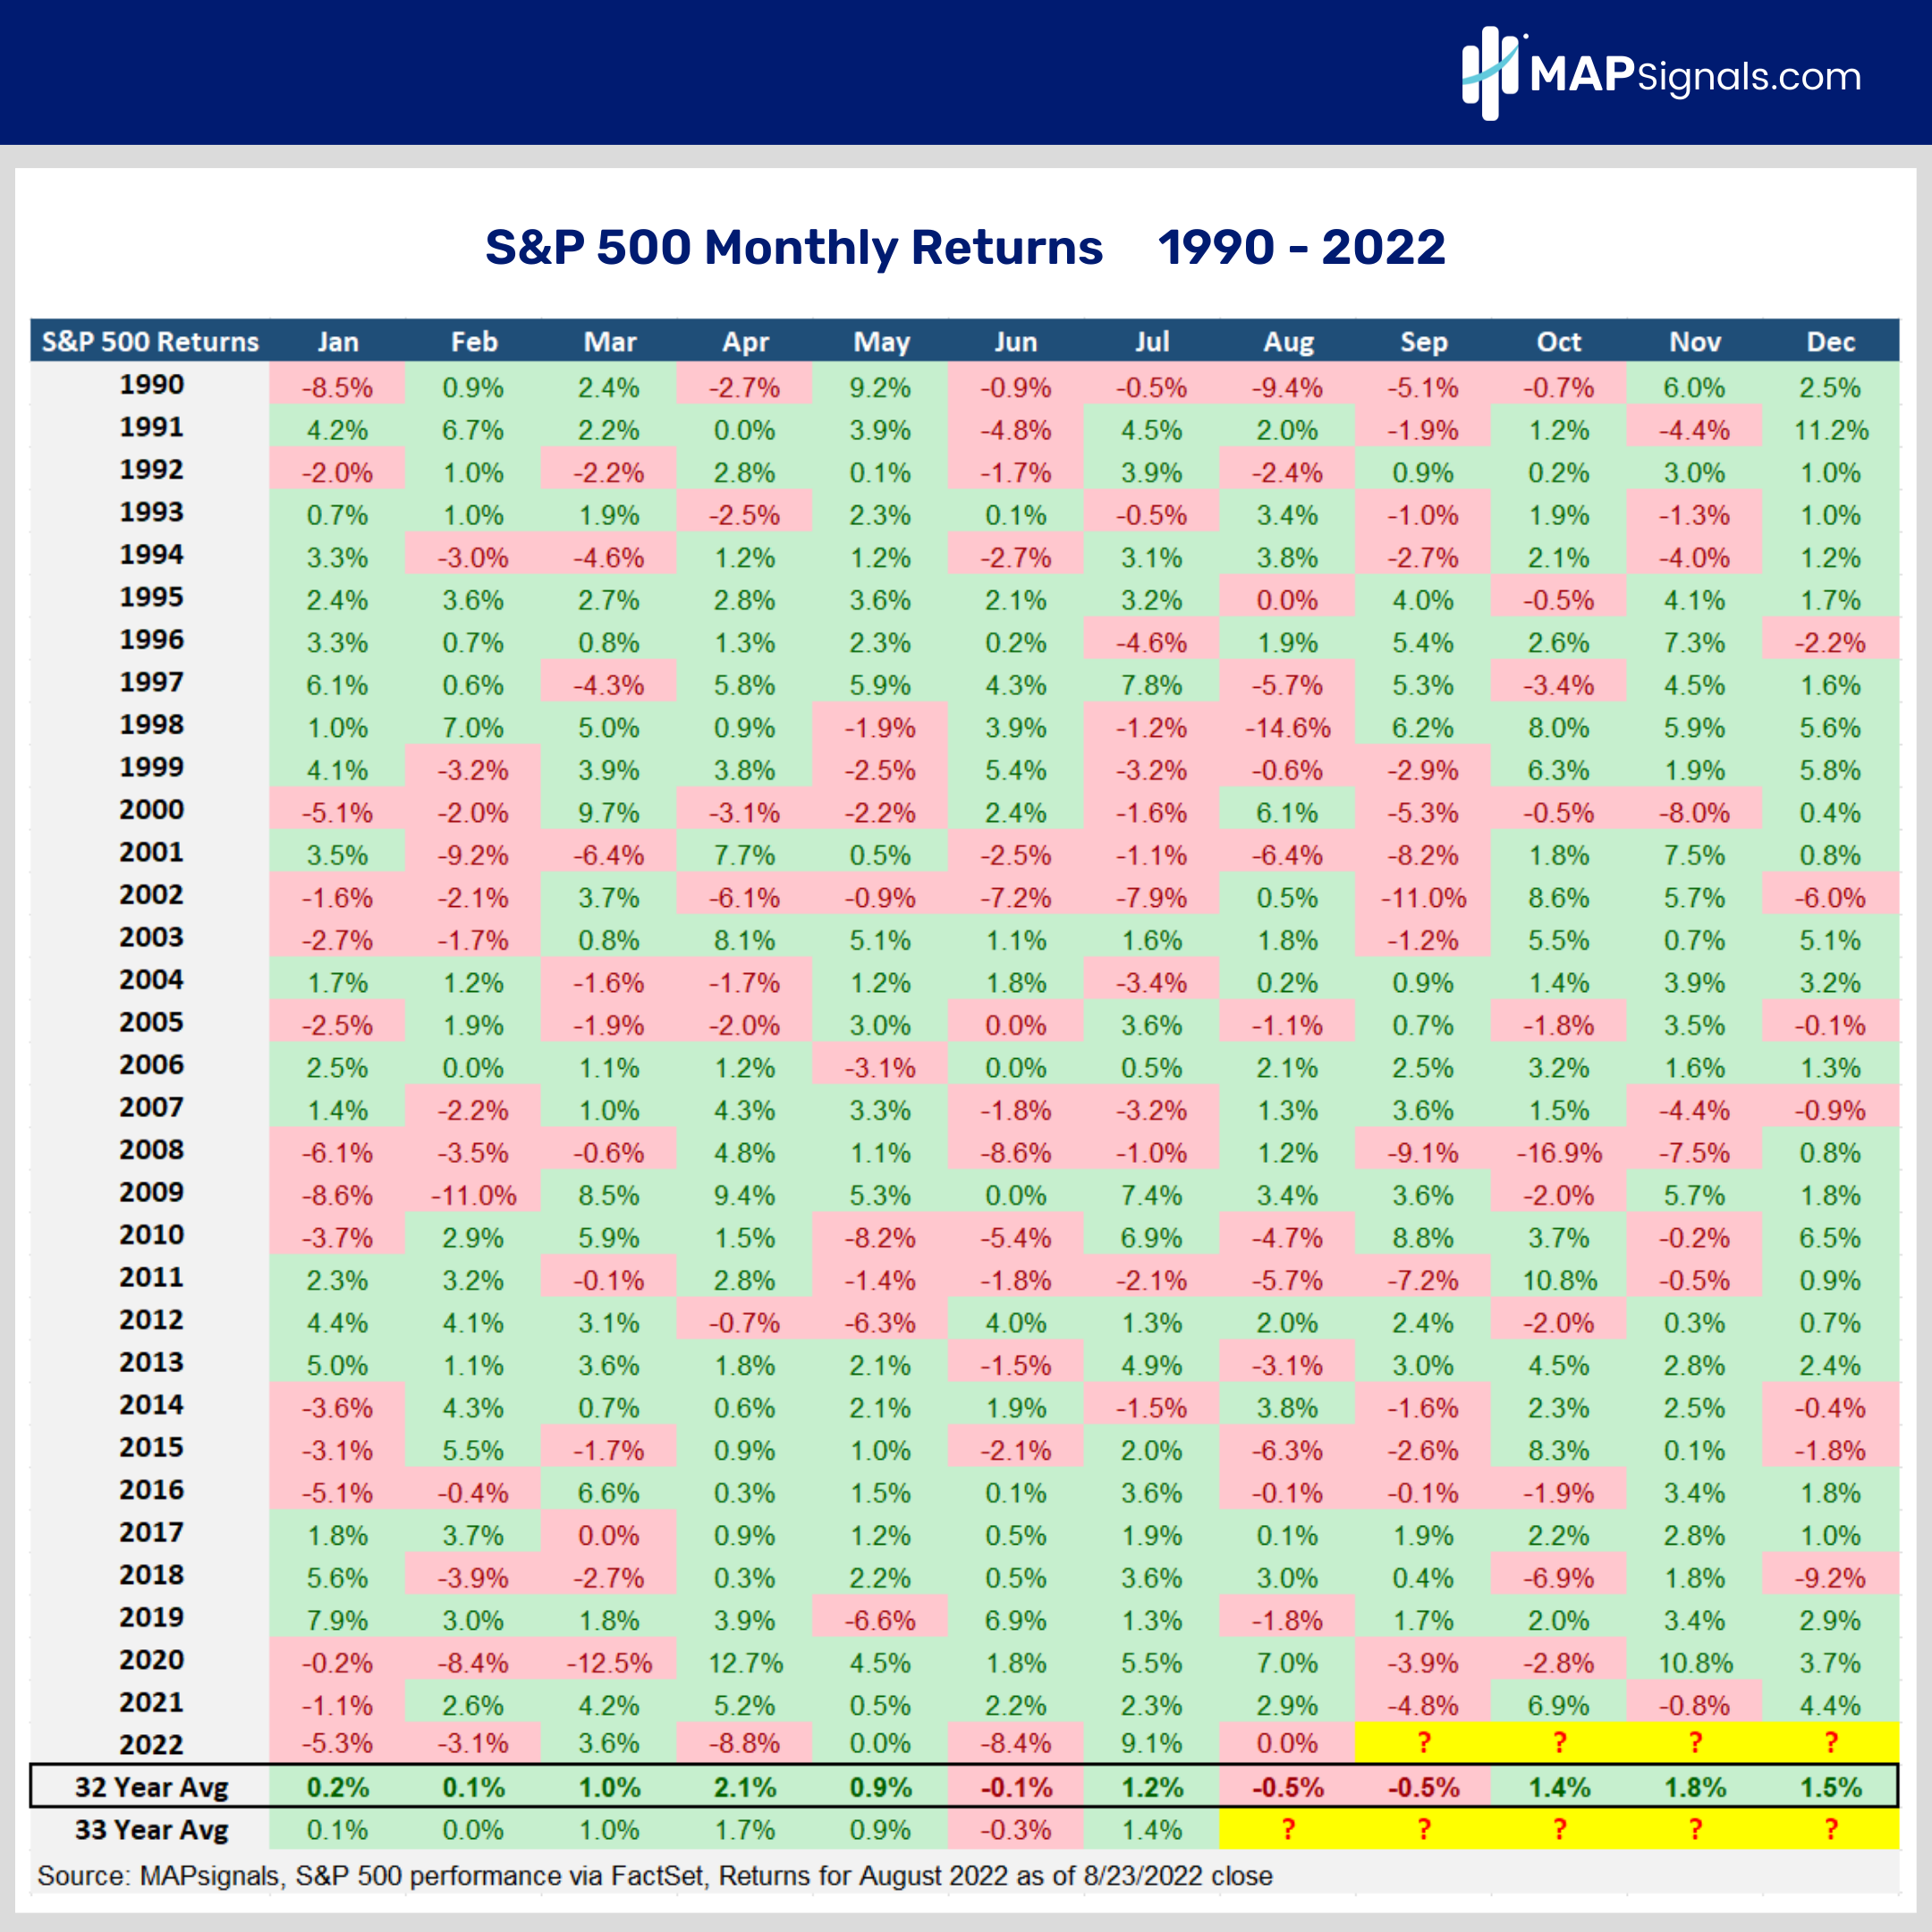
Right off the bat that tells you to plan for a weak September, then expect brighter days into year-end. But what about midterm election years?
This seasonal pattern actually performs stronger. In midterm election years going back to 1990, September performs a tad strong with an average return of -.3% while October and November post handsome gains of +2.5% and +2.4% respectively:
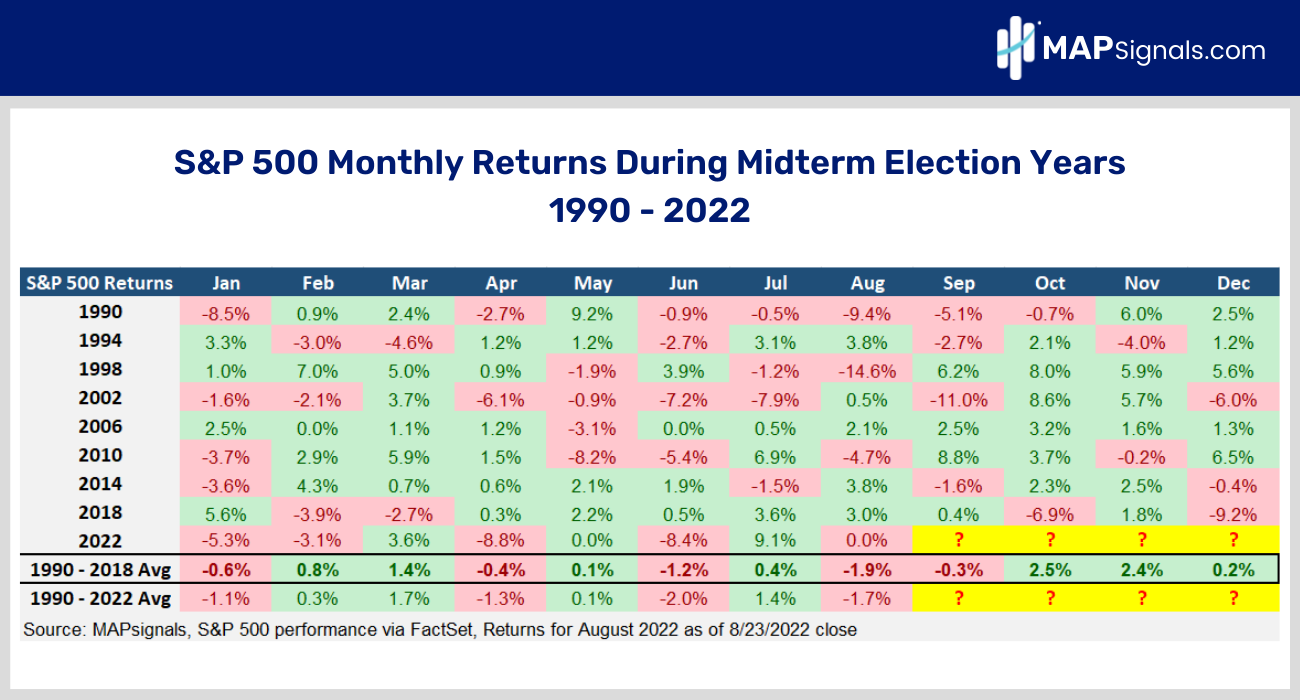
This solid performance has the making of a midterm election stock market playbook. But, are there other patterns we can study for clues? Yes.
Our Big Money Index (BMI) has a strong seasonal pattern in midterm election years, too. Typically, we witness a downward BMI heading into October, then a major ramp into November.
Charts always make recurring patterns easier to spot.
Here’s 1994–2006. Notice how in September the BMI is usually in a downtrend while October begins a new uptrend:
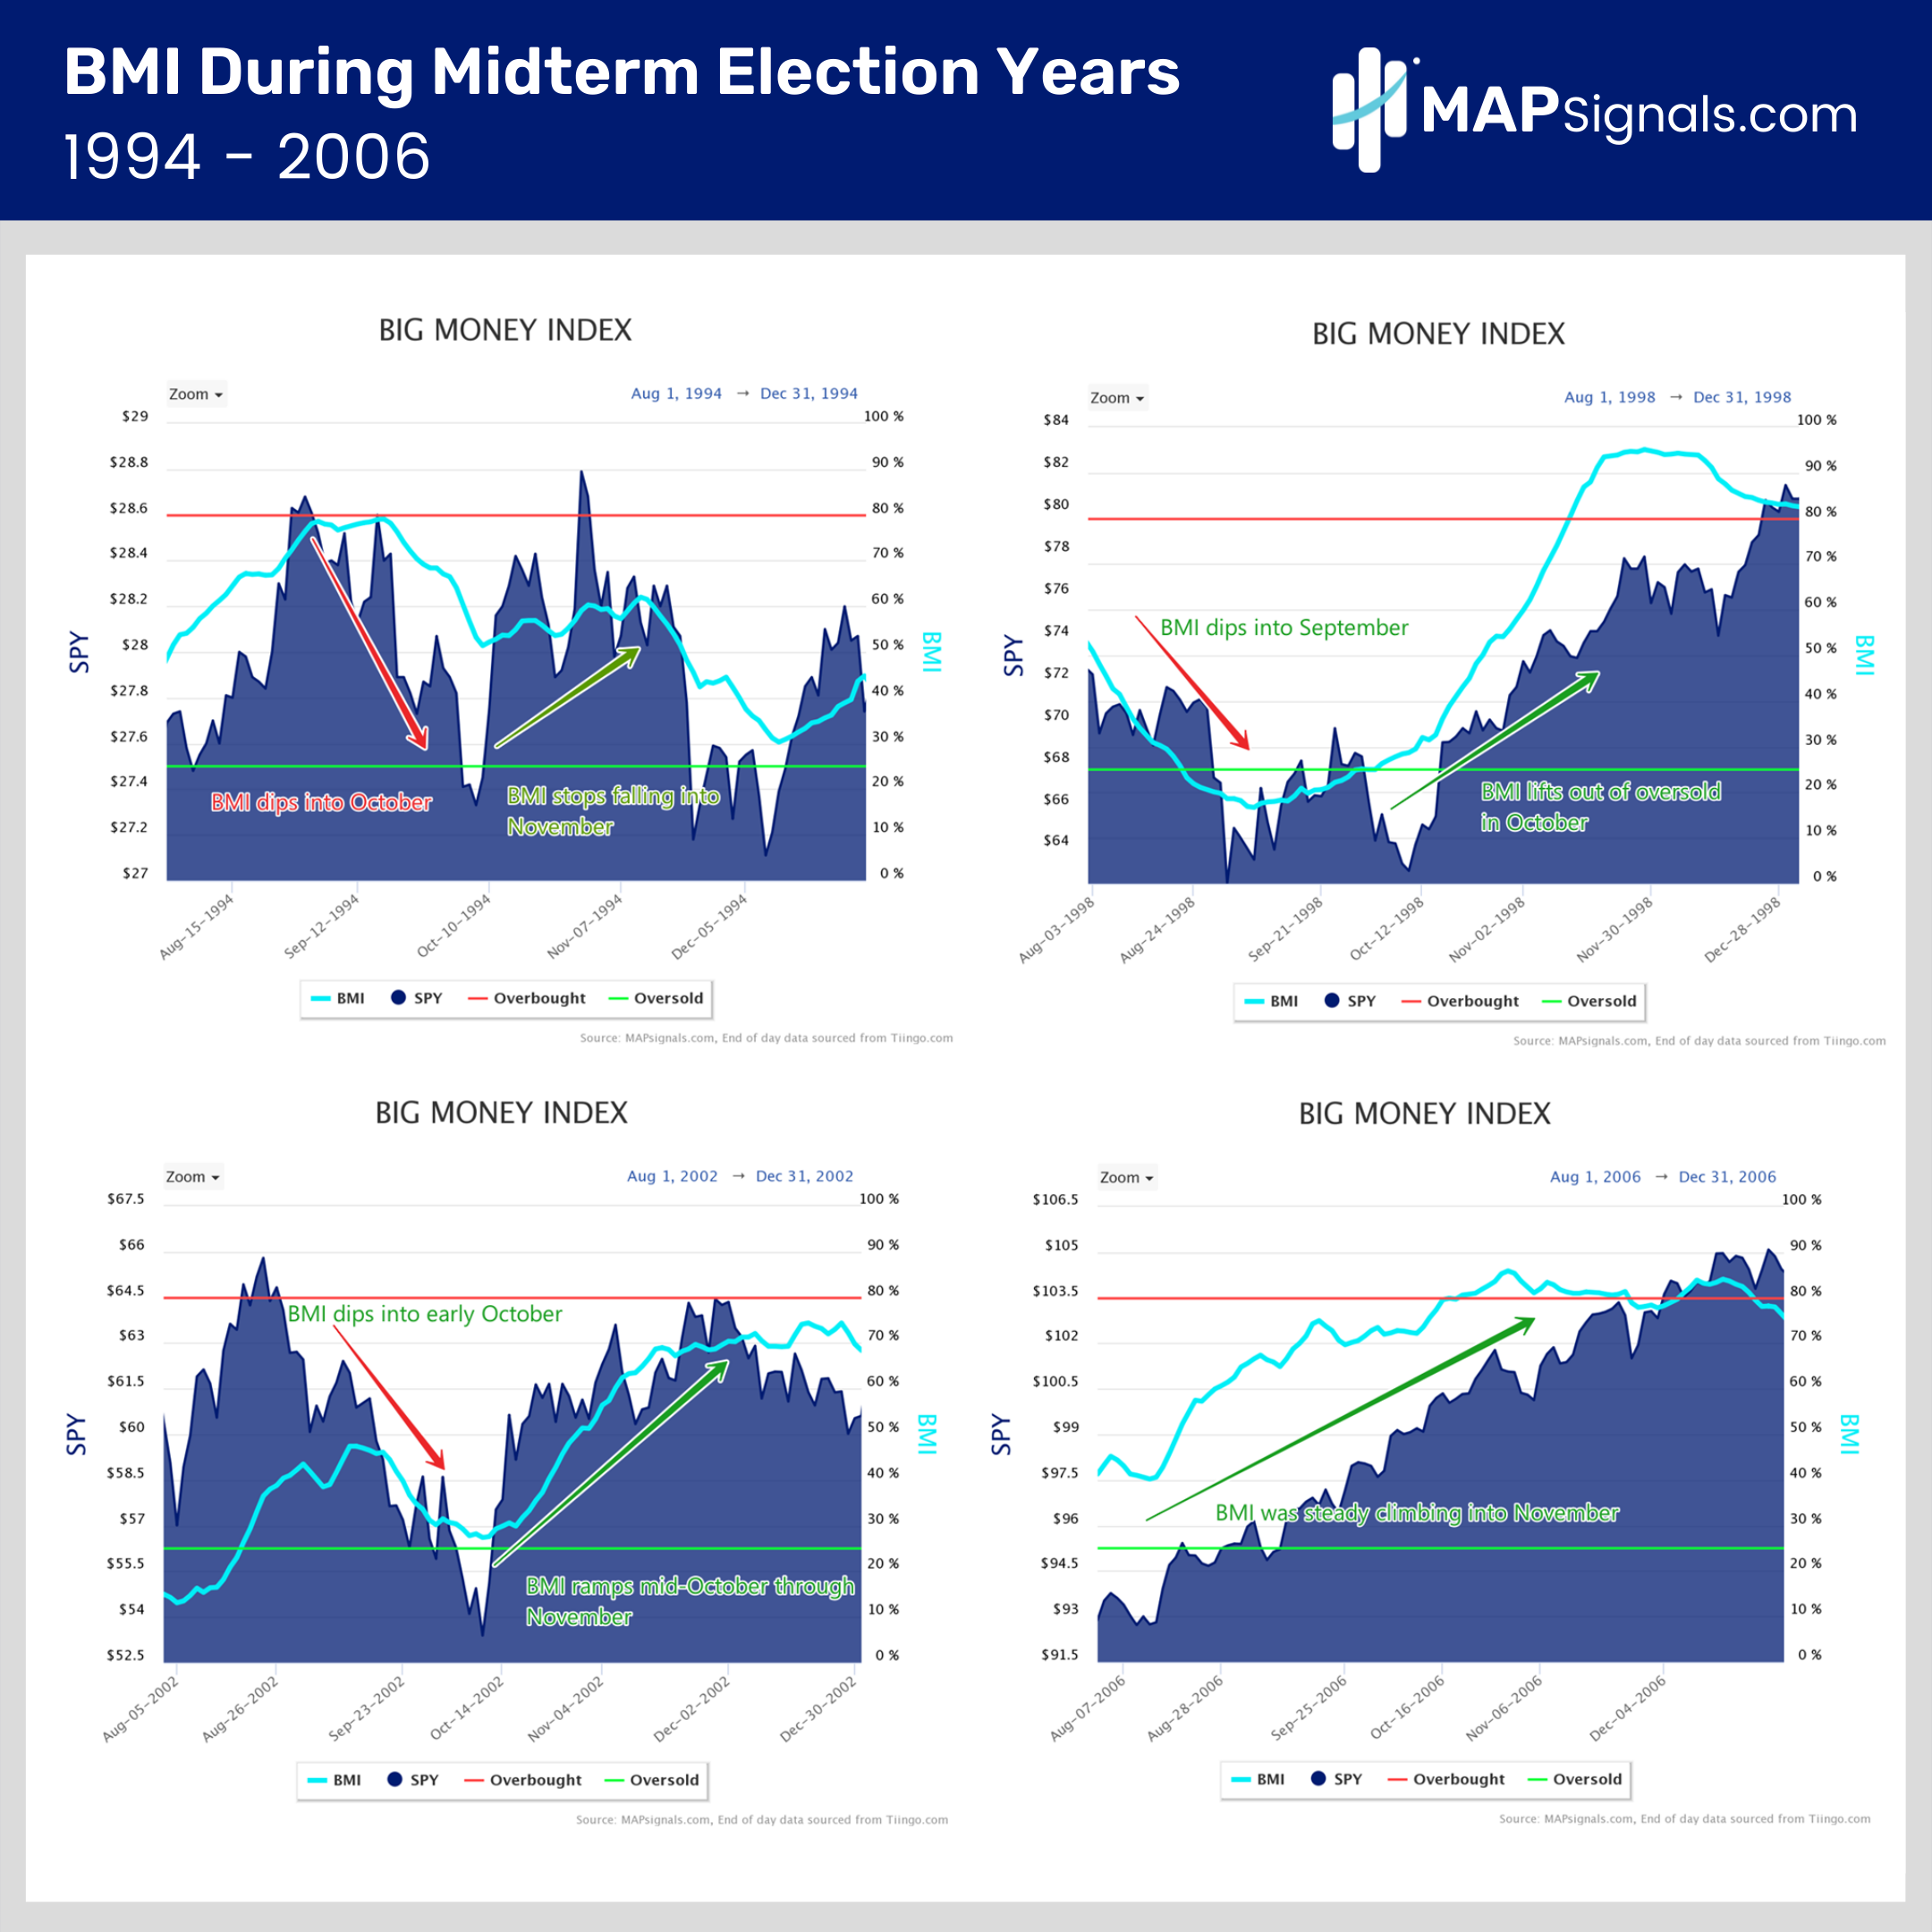
As large investors return to the office in September after Summer vacation, volumes and volatility surge. This causes markets to bob and weave as end-of-year bets are made.
Let’s keep going.
Viewing 2010–2018 you’ll notice the same pattern emerges. Weakness in September shifts to strength in October and November:
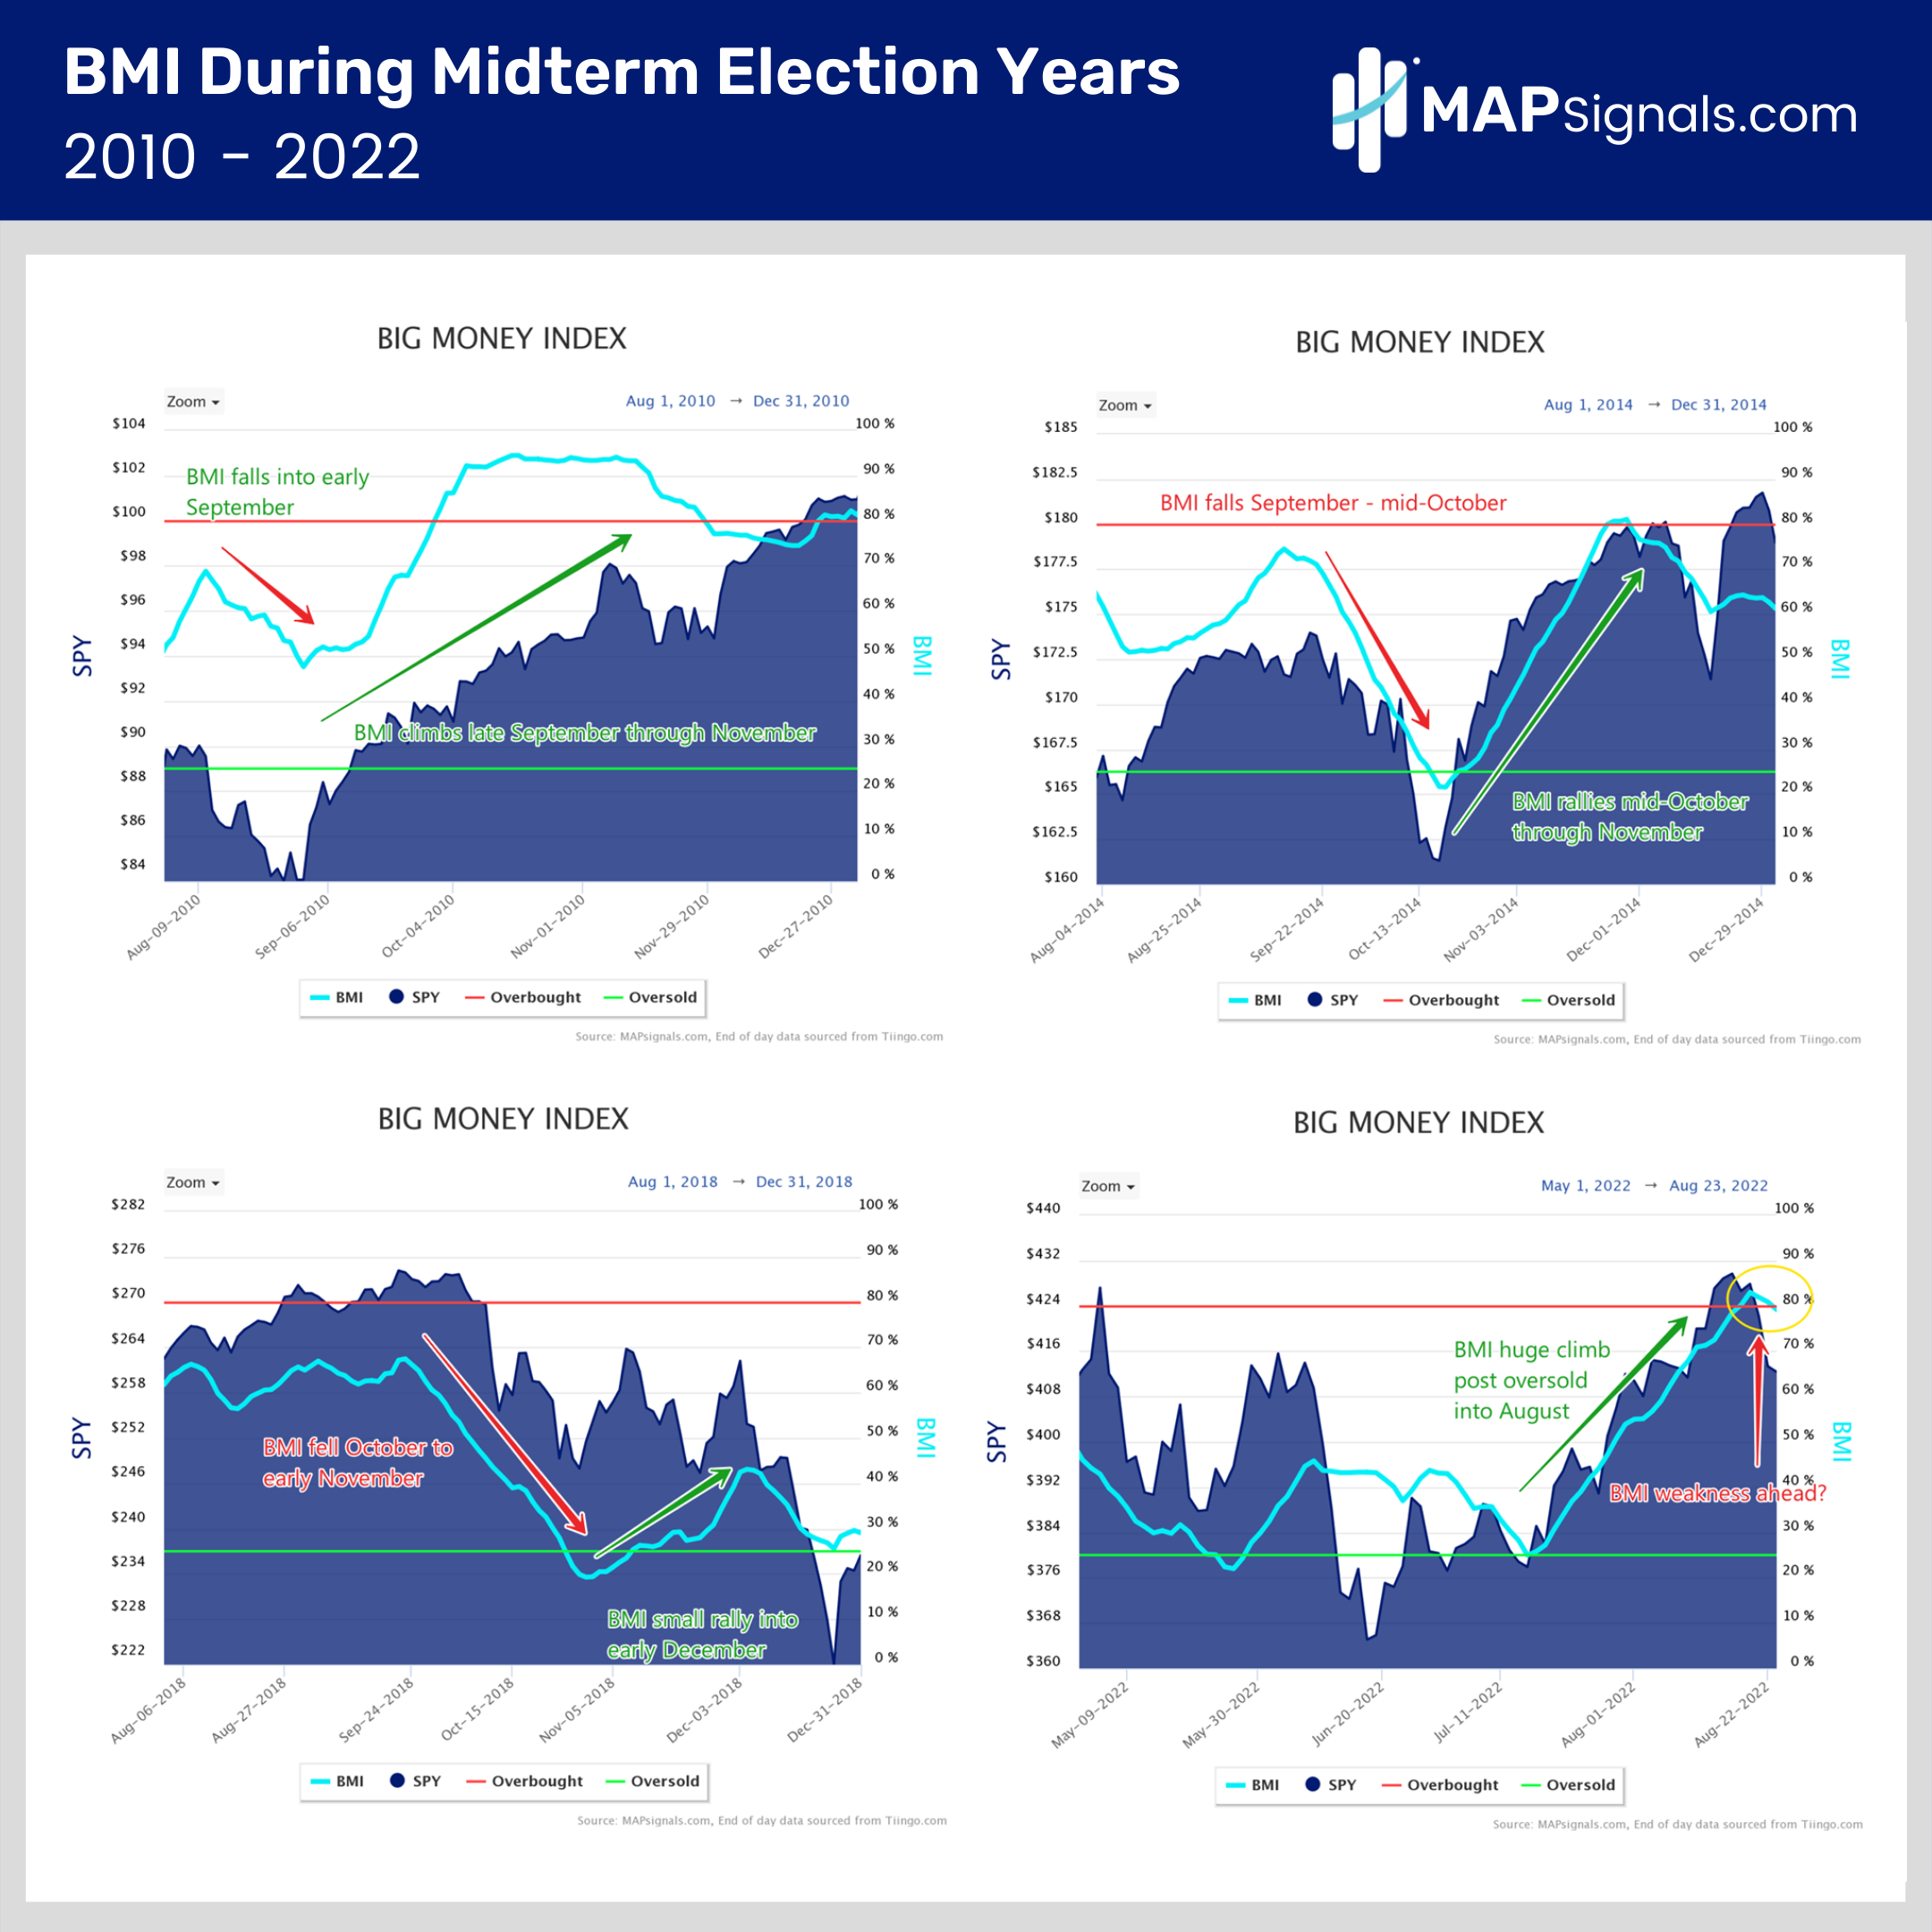
Over the past decades, the sell in September, buy in October and November playbook has been pronounced. This brings me to today’s market environment.
Above on the bottom right, you’ll see 2022. Markets triggered oversold in mid-July and since then we’ve broken into overbought territory. Recently the BMI fell below the red zone.
Will this midterm election year play out in a similar fashion to recent history? I believe it’s possible.
Last week, I noted how once the BMI breaks below 75%, it can spell trouble for stocks. Given there’s a strong tendency for weakness in September, it’s a decent bet to expect lower BMI readings as we approach the upcoming midterm election season.
Data can signal that there’s weakness under the surface of the market.
But don’t get too bearish! Ugly Septembers often preface bountiful Octobers and Novembers—especially in midterm election years. The Big Money Index can help guide you through cloudiness.
Let’s wrap up.
Here’s the Bottom Line
As we approach September, use caution. September is a red month on average going back to 1990. That’s the bad news. The good news is stocks pop in Q4. And during midterm election years, October and November produce big performances, with +2.5% & +2.4% gains respectively for the S&P 500.Add to it the consistent pattern of the Big Money Index, and you’re looking at a solid midterm election stock market playbook! MAPsignals’ unique lens on institutional activity can make a difference. Look, the future isn’t guaranteed. However, utilizing history and a data-based approach to investing, the odds get stacked in your favor. That’s what we’re all about!
To learn more about Lucas Downey, visit Mapsignals.com.


