

Forget the employment report, there are bigger things to be concerned about, states Joe Duarte, editor of In the Money Options.
September is traditionally a bad month for stocks. And with the Fed draining $95 billion in liquidity from the banking system as it accelerates QT, things could go from bad to worse, although bearish sentiment is increasing and the market is getting very oversold.
There are still areas of the market that are worth considering, such as select stocks in the natural gas, oil, and nuclear energy sectors. But even their risks are rising as the Fed tightens, and the G7 and Russia are now playing a dangerous game with the world’s oil supply.
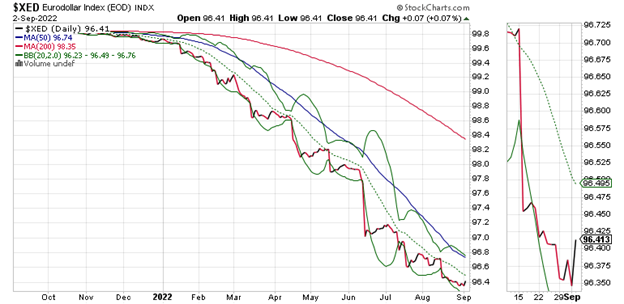
Still, there was a glimmer of hope at week’s end as the Eurodollar Index moved decidedly higher. We’ll have to see what develops from this, as a move higher in the Eurodollar Index is often a bullish sign for stocks.
Resource Pain
On 9/2/22, the G7 agreed to place a price cap on Russian oil. Never mind that the odds of success due to the reality of implementation are close to zero.
The Russians answered by threatening to cut off oil from anyone who joined the pact. And then, suddenly, they found a leak in the Nord Stream One natural gas pipeline to Europe (which already had a reduced flow by 40% of normal levels) after they had announced that routine repairs were successful and that the “temporary” halt to flows would resume.
Stocks immediately gave up a nice bounce and oil prices rolled over.
In other words, a significant portion of the oil supply is now openly a bargaining chip for Russia and the G7 as the war in Ukraine drags on.
Welcome to the Edge of Chaos
“The edge of chaos is a transition space between order and disorder that is hypothesized to exist within a wide variety of systems. This transition zone is a region of bounded instability that engenders a constant dynamic interplay between order and disorder.”—Complexity Labs
Hot Spots are Getting Hotter
Ukraine is the hottest spot in the world currently. A longer problem is the potential for rising collateral damage as the ripples of the conflict spread.
Consider the following:
- Megadroughts in Europe, the Southwest US, and China have significantly reduced hydroelectric power generation and are showing no signs of reversing.
- China is shutting down cities again due to Covid outbreaks squeezing the global supply chain.
- Europe has filled its natural gas stores to its stated goal of 80%, but that’s only enough to cover 30% of winter consumption.
- US natural gas supplies remain below last year’s pre-winter levels and below the five-year average. The EIA estimates that by the time winter arrives, they will be 12% below average.
- US Oil supplies remain 6% below last year. Gasoline and diesel (heating oil) are also well off their norms with diesel supplies checking in at 23% below last year.
- The oil rig count has stalled while natural gas rigs are flattening out.
- France on 9/2/22 announced it is restarting all of its nuclear reactors. But water is scarce so reactor cooling may be an issue.
So, the real question is why are oil and natural gas prices falling when there are some potentially dangerous supply issues lurking out there?
It’s the Grid, they Say. But What About Putin?
Talk about the butterfly’s wings flapping. California plans to phase in electric cars (EV) by 2030, but recently warned drivers to avoid charging their EVs over Labor Day weekend as their electric grid is in danger of failing. That doesn’t add up unless, of course, you factor in that while much of the world has been erecting wind turbines and building solar farms, most countries, especially the US haven’t upgraded their grids to handle the new power they are creating.
According to reports, the problem isn’t necessarily financial, but political. Recently passed legislation has $2.5 billion earmarked for grid expansion and improvement projects. But reportedly rivalries between utility companies, local and state bureaucracies, and the fear that consumers won’t want to pay higher electric bills are keeping the expanding renewable generated resources from actually being connected to the grid efficiently. Of course, there is also the issue of cloudy days and days with no wind to contend with in regard to renewable power generation.
All of which points to batteries and nuclear power as potential solutions. But batteries are not without issues, such as maybe there isn’t enough lithium in the world to power all the storage needs that are being projected. And no one wants a nuclear plant near their house.
On the other hand, there is a very short term to consider—this winter. All of which brings me back to the original question. Why are oil and natural gas prices falling when it’s obvious that there is above-average potential for shortages of both this winter?
Well, as far as I can tell, it’s one of three things:
- China’s economy is much worse than anyone is saying and insiders are selling oil and gas before the news hits. This would dampen demand.
- As Saudi Arabia has recently said: the futures markets are disconnected from reality, as in the real world oil supplies are much lower than the futures prices indicate.
- Putin is betting that Europe is near the economic breaking point and that it’s time to push it over the edge, which would create a major economic disaster and reduce oil demand.
There is one more wildcard on the table, the US-Iran nuclear deal. Oil Price.com reports that Iran has anywhere from 60-70 million barrels of oil floating in offshore tanker reservoirs which could hit the market in short order if there is an agreement.
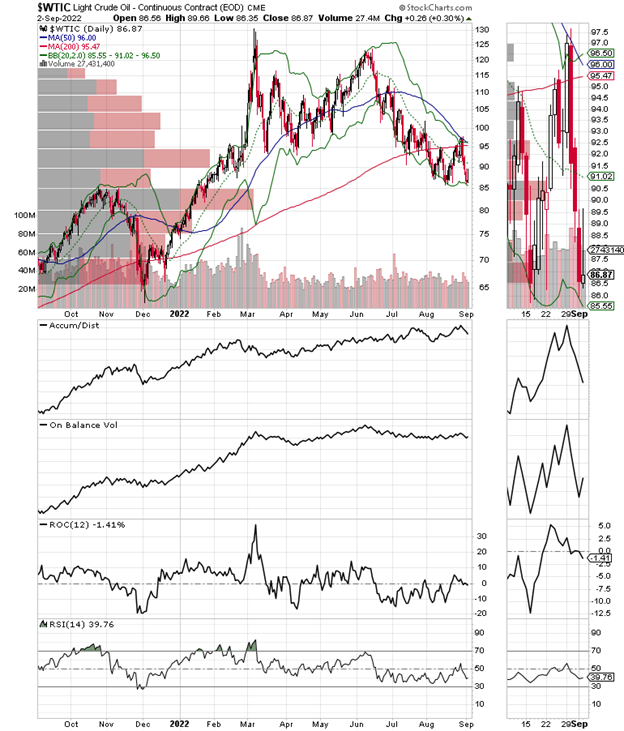
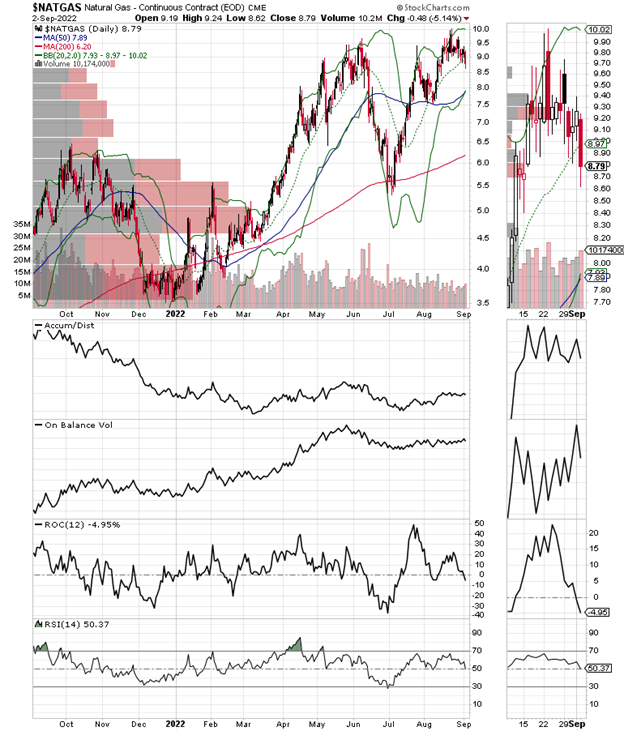
The price charts for both crude oil and natural gas suggest consolidation patterns are unfolding with crude being a bit more bearish as it’s trading below its 200-day moving average with the $90 price area being a pretty stout line in the sand. Natural gas looks more bullish but $10 has been a hard price wall to crash through.
Indeed, the complexity of the world’s energy situation, calls for multiple trading options.
Bonds Yields Rise. Liquidity Gets a Bump Up.
Bond yields pushed higher last week with the US Ten-Year Note Yield (TNX) brushing up against the 3.25% level, its highest in nearly three months. Part of it was related to Eurozone inflation clocking in at over 9% on a year-over-year basis.
But more important for the longer term, the Fed is now taking out $95 billion from the financial system per month as part of its QT program. That’s bearish for stocks.
Still, the Eurodollar Index delivered a nice jump higher at the end of the week, which may be a positive.
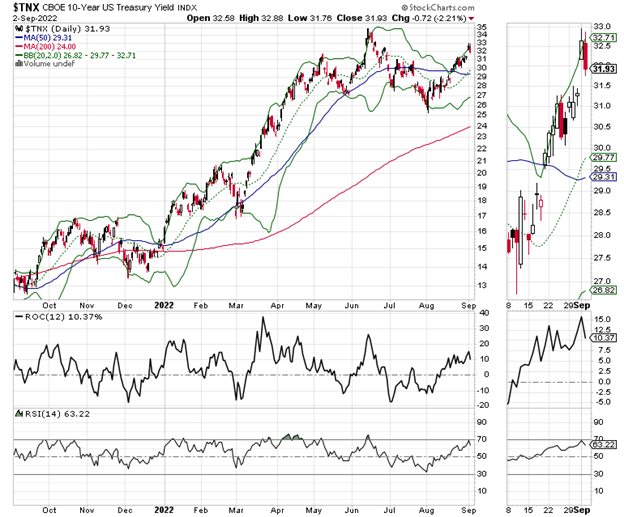
Still, bonds have a new trading range for TNX between yields of 3-3.25%.
No Bounce Evident in Extremely Oversold Stock Market
The stock market is well overdue for a bounce. But oversold markets can stay oversold for a long time.
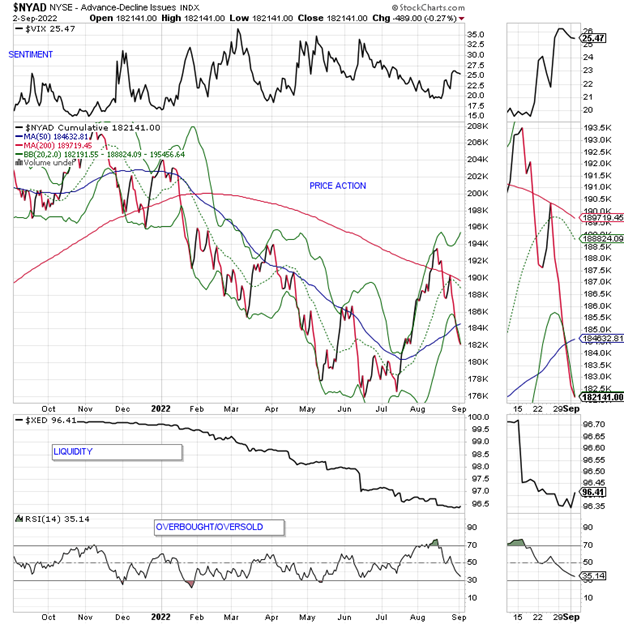
The New York Stock Exchange Advance-Decline line (NYAD) has not recovered from the Powell speech, now making new lows on a regular basis, which means systemic selling and short selling is ongoing.
NYAD sliced through its 50-day moving average easily while the RSI hovers near 30.
The CBOE Volatility Index (VIX) remained above 25, remaining in a bearish posture as put option buyers continue to add to positions.
The S&P 500 (SPX) crashed through 4000 and its 50-day moving average, failing on its first attempt to rise above the now key resistance levels. Accumulation Distribution (ADI) has topped out meaning that short sellers are back. On Balance Volume (OBV) is not showing any positive signs at the moment.
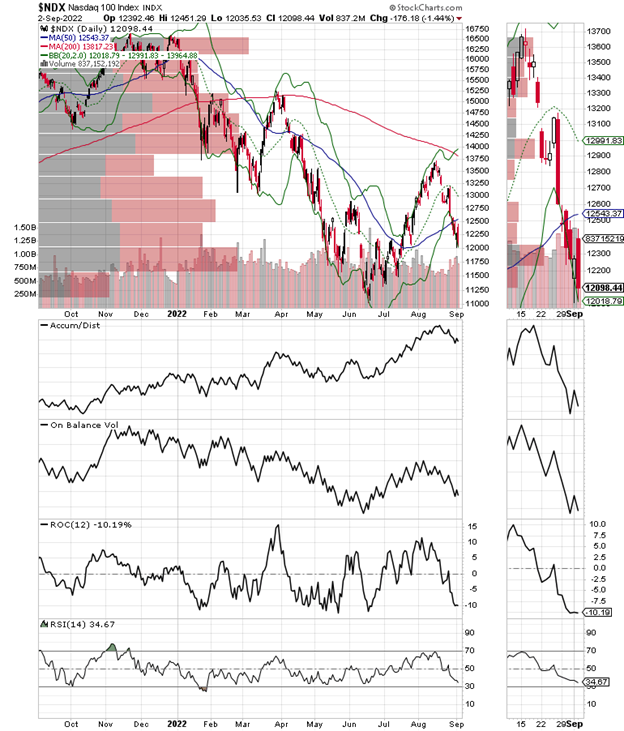
NDX, 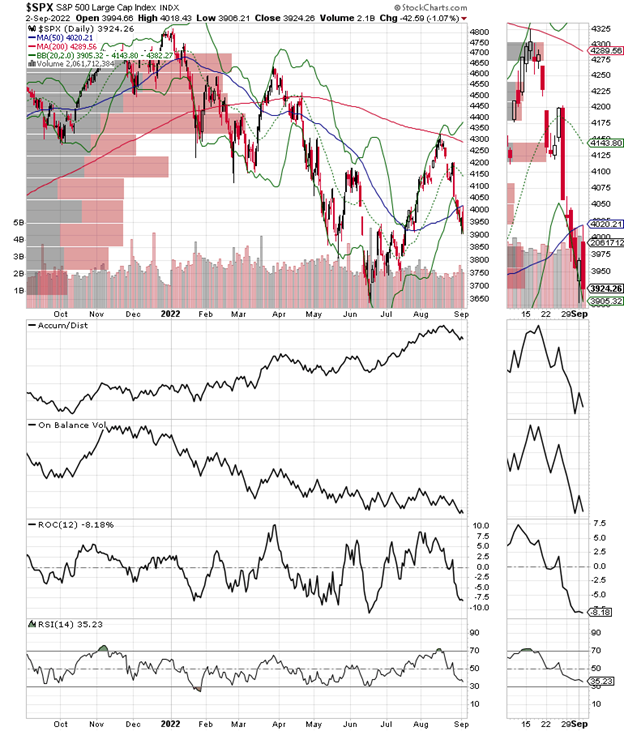
The Nasdaq 100 Index (NDX) remained below 13,000 and its 20-day moving average. Accumulation Distribution (ADI) and On Balance Volume (OBV) remain bearish here as well. 12,000 is the next support level.
To learn more about Joe Duarte, please visit JoeDuarteintheMoneyOptions.com.


