

The current debate about the trend of stocks, commodities, and bond yields focuses on two scenarios, states George Dagnino of Peter Dag Strategic Money Management.
Scenario one is as follows. QE forced interest rates to decline. QT must therefore cause yields to rise. An excessive supply of Treasuries reduces liquidity as the Fed decreases its balance sheet. Market participants are then forced to sell assets (stocks and bonds) to reestablish needed cash reserves. This decision causes stocks to decline and bond yields to rise.
Scenario two suggests the business cycle is alive and well. Under this scenario stocks and commodities will decline and bond prices will rise (yields go lower). Let me explain.
The Fed is heralding major increases in interest rates. Little has been reported, however, about the growth of money and its impact on the economy and the markets. I will focus on the monetary trends provided by the St. Louis Fed.
This analysis uses the historical relationship between leading-coincident-lagging indicators as discussed in detail in my book, Profiting in Bull or Bear Markets—How Business Cycles Impact the Financial Markets. I recognize my analysis uses a limited view of the Fed’s “toolbox,” but it is based on a reliable historical record, strong enough to provide useful strategic guidelines.
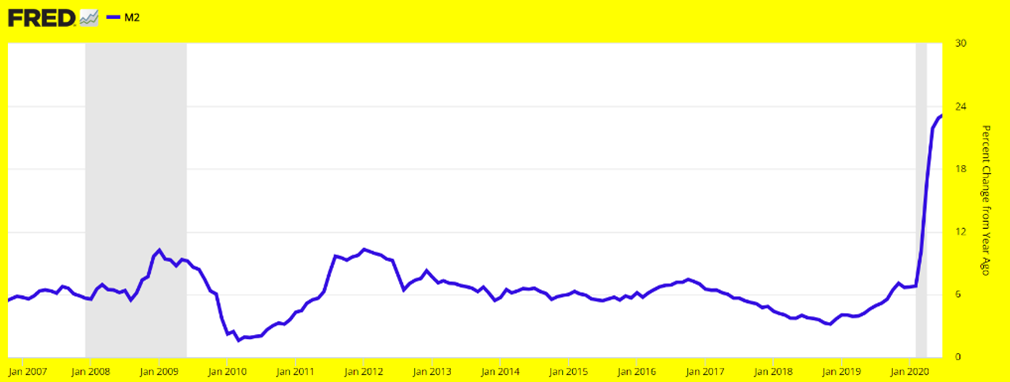
The 2008 financial crisis forced the Fed to increase liquidity in the system. The growth of the money supply M2 jumped from 1.6% y/y in March 2010 to 10.3% y/y in January 2012. Growth of M2 steadily declined to a slow 3.2% y/y in November 2018. M2 growth ranged between 3% and 7% for a major part of the decade. Growth exceeded briefly in this range from July 2011 to June 2012, with growth rates of 9%-10% (see above chart).
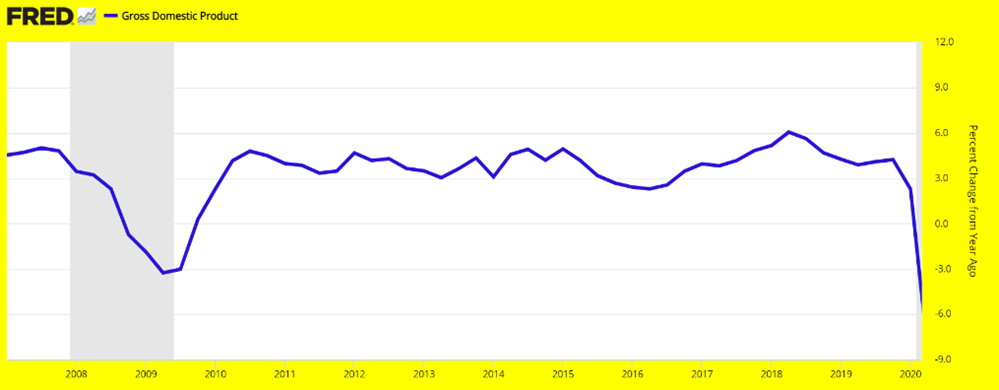
For most of the decade from 2008 to 2019 (see above chart) nominal GDP expanded at a rate close to 3.5% as M2 growth ranged between 3%-6%.
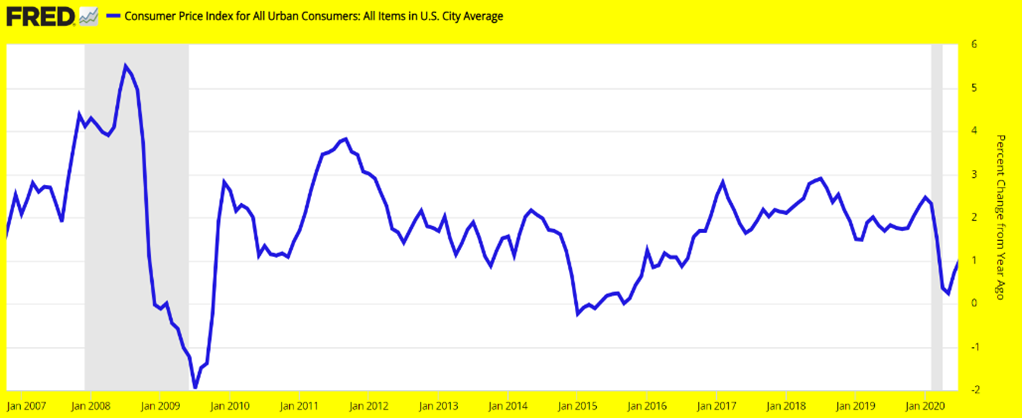
In that decade, inflation, measured as the change in consumer prices, ranged between 0% and 3% (see above chart). Let me recap the basic elements of the 2010 decade. M2 growth: 3%-6%. GDP growth: 3.5% including inflation. Inflation: 0%-3%.
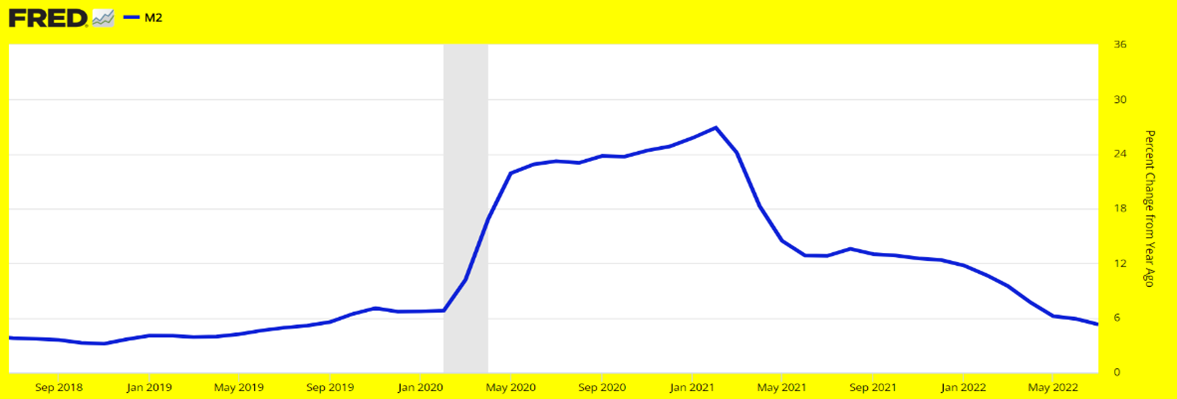
In 2019 growth of M2 began to rise from 6% to 26.9% in February 2021 (see M2 chart). The massive increase in M2 was used to finance government stimulus programs and protect the financial system from the dire consequences of the lockdown. Monetary growth was unprecedented, and it had major implications for the economy and inflation in the following years.
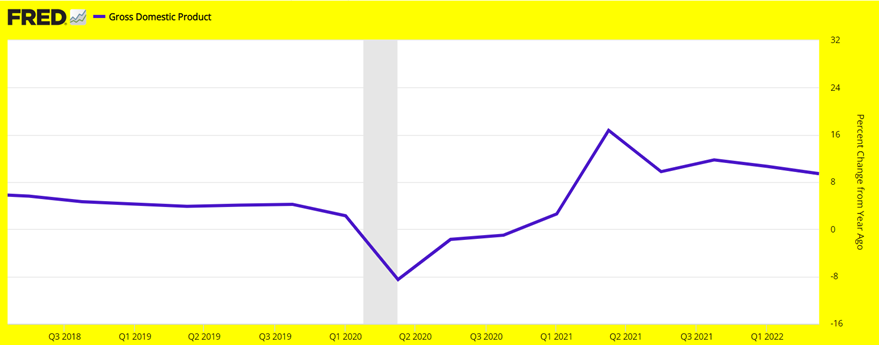
The growth of the economy, as measured by GDP, bottomed in 2020 and reached the historically high pace of 16.8% y/y in Q2 2021 (see above chart). This unrealistic growth rate was in direct response to the explosion in the monetary aggregate M2. This situation could not last much longer since the current long-term growth rate of the economy is about 2.0%.
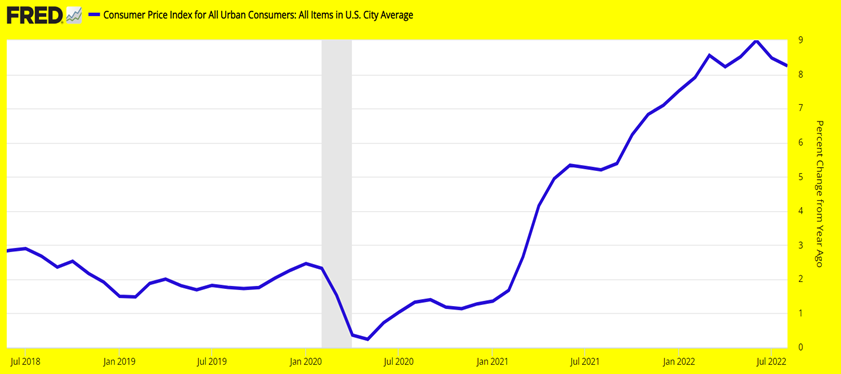
The strength in the money supply M2, followed by historically high growth rates in GDP, was eventually followed—as it has happened in all previous business cycles—first by rising commodities and then inflation. Inflation rose from 1.36% in January 2021 to the most recent peak of 9.0% in June 2022 (see above chart).
Let me recap what has happened since 2019. In 2019 M2 (a leading indicator of the business cycle) started growing at an unprecedented pace. The economy, as measured by nominal GDP (a coincident indicator of the business cycle), expanded also at historically high growth rates. Inflation, as measured by the CPI (a lagging indicator of the business cycle), followed the historically higher rate of economic growth with the highest inflation rate in the past 40 years.
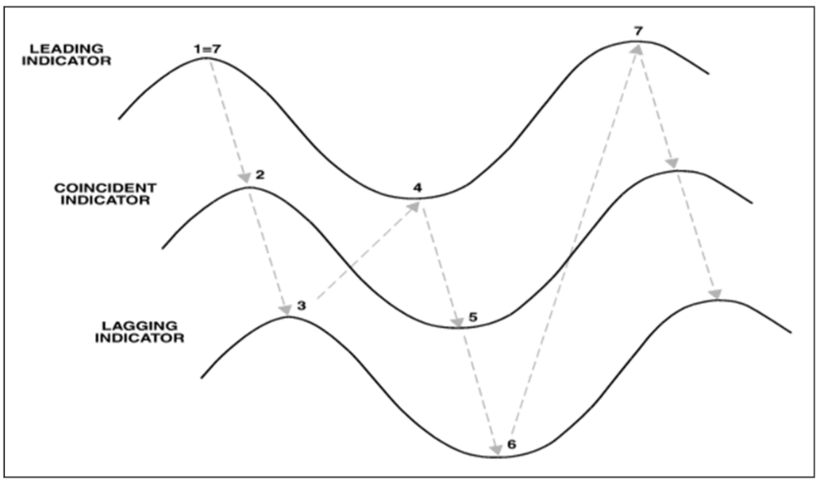
Please note the sequence of turning points of leading, coincident, and lagging indicators at peaks and at bottoms. What has been happening, and will happen, follows the sequence taking place in a typical business cycle (see above chart).
The rise of a leading indicator is followed by the rise of the coincident indicator which is then followed by the rise of the lagging indicator. The rise in the lagging indicator is followed by a peak in the leading indicator.
The rise in inflation has been followed by the peak in the growth of M2 in February 2021 at 26.9% as the above model suggests. The current growth rate of M2 is 5.3% as of July 2022. The deceleration of M2 is as unprecedented as its growth from 2019 to 2021.
The deceleration of M2 is being followed by a peak in GDP growth in Q2 2021—exactly as the above model suggests.
Inflation peaked in June 2022 (see above chart), following the peak in the coincident indicator GDP. Again, exactly as the model suggested.
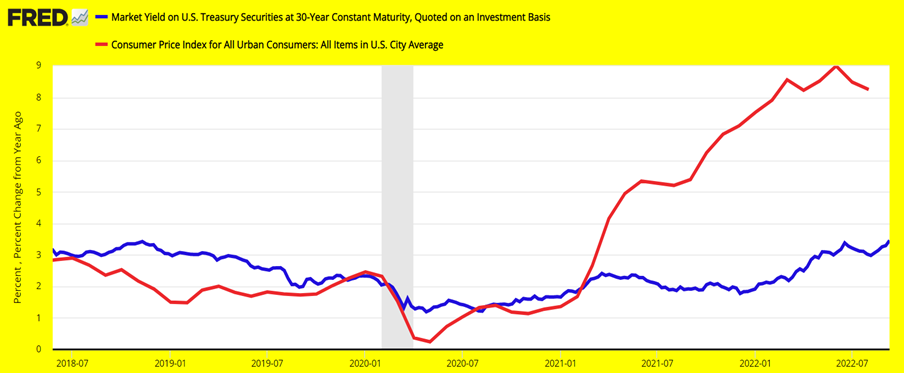
The point is M2—a leading indicator during the expansionary phase of the business cycle—is also leading the economic growth, a coincident indicator, during its slowdown period which started in Q2 2021. Inflation—a lagging indicator—peaked a full year after the peak of the growth in GDP. Bond yields—a lagging indicator—follow closely the inflation pattern and they also are close to a peak.
The historical relationship between the coincident indicator (GDP, commodities) and leading indicators (M2) suggests the economy will continue to weaken until the growth of M2 rises for at least a year. Meanwhile, inflation and eventually bond yields will continue to decline.
Key Takeaways
- What is happening in the economy follows the historical business cycle relationships between leading-coincident-lagging indicators.
- The historically unprecedented growth rate of M2 was followed by historically unprecedented growth rates of the economy, commodities, and inflation, causing bond yields to rise.
- The sharp and protracted slowdown in M2 will cause the economy to slow down at least until late in 2023.
- The stock market will decline following the slowdown of M2 and the inversion of the yield curve—another reliable leading indicator.
- Defensive sectors such as Utilities (XLU), Healthcare (XLV), and Staples (XLP) will keep outperforming the S&P 500 (SPX) during the period of economic slowdown.
- The stock market and M2 will resume their growth following a protracted decline in inflation and interest rates, an improvement in consumers’ purchasing power (decimated by the current inflationary bout), and a steepening of the yield curve of about a year.


