

There was no place to hide, an ugly week, with the Dow, S&P 500 (SPX), Nasdaq, and all eleven S&P SPDR sectors down, notes Bonnie Gortler of bonniegortler.com.
Healthcare (XLV) and Energy (XLE) fell the least, while Industrials (XLI) and Materials (XLB) were the worst sectors. The SPDR S&P 500 ETF Trust (SPY) fell sharply down -4.79% giving back all the previous week's gains and more.
Figure 1: S&P SPDR Sector ETFs Performance Summary
9/9/22 – 9/16/22
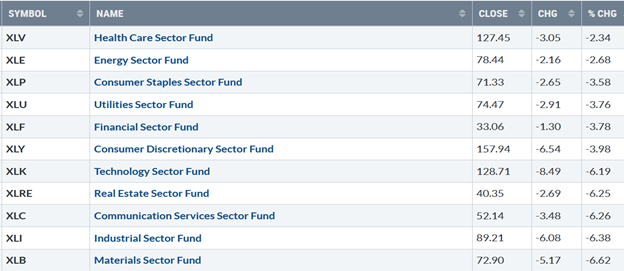
Source: Stockcharts.com
Figure 2: Bonnie's Mix of ETFs
Performance Summary 9/9/22 – 9/16/22
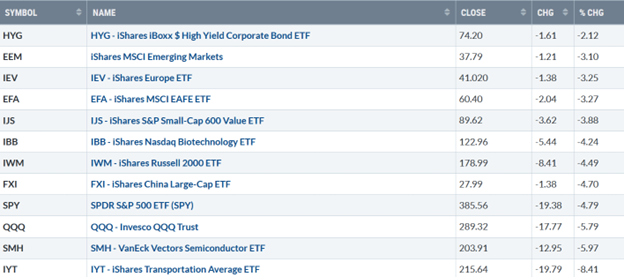
Source: Stockcharts.com
The decline was broad as investors sold stocks unwilling to take risk last week, with Transports and Semiconductors leading the way down. After showing strength the previous week, nasty reversals to the downside occurred. High-yield bonds had no follow-through and reversed lower and international markets remained weak and continue to lag behind the US market.
Figure 3: UST Ten-Year Bond Yields Daily
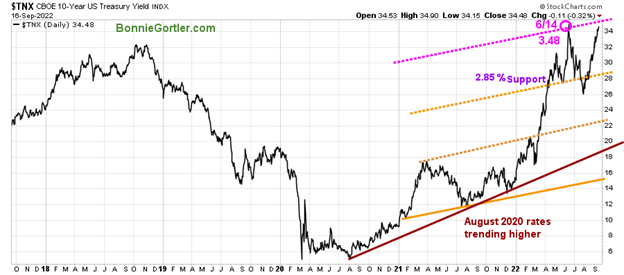
Source: Stockcharts.com
The Ten-Year US Treasury yields rose, closing at 3.448% last week, near the June highs. A close above the highs would suggest yields could continue higher between 3.60% and 3.80%. Support is at 2.85%, followed by 2.30%.
The major averages closed near their worst levels of the week. The Dow fell -4.13%, S&P 500 down -4.50%, and the Nasdaq, the worst performer, down -5.48%. The Russell 2000 Index was also weak, down -4.04%, while the Value Line Arithmetic Index (a mix of approximately 1700 stocks dropped -4.92%.
Weekly market breadth was poor on the New York Stock Exchange Index (NYSE) and Nasdaq. The NYSE had 630 advances and 2830 declines, with 99 new highs and 480 new lows. There were 1379 advances and 3861 declines on the Nasdaq, with 165 new highs and 736 new lows. Continued poor market breadth is a negative sign for an upside reversal in the short term.
Figure 4: Nasdaq Advance-Decline Line (Daily)
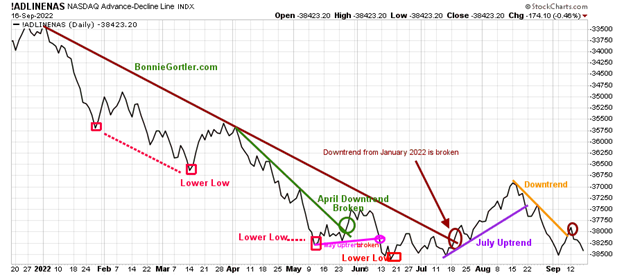
Source: Stockcharts.com
At the end of May and early June, after breaking its April downtrend (green line), there was an improvement in breadth that stalled quickly, and Ad-Line made a lower low. In July, market breadth improved, starting an uptrend in the AD-Line and a powerful advance in the Nasdaq, but in August, market breadth weakened again.
After a disappointing CPI report last week, buying turned to extensive selling as the week progressed. As a result, program selling by institutions accelerated the decline as short-term support levels broke. An immediate improvement in market breadth is needed for a short-term rally to begin.
Figure 5: CBOE Volatility Index VIX
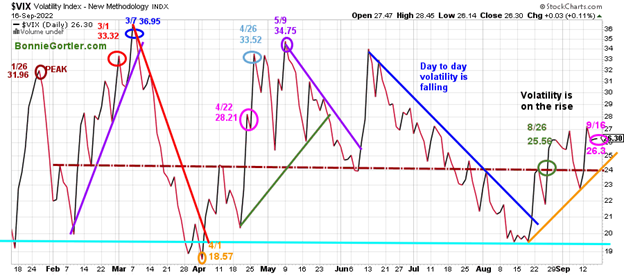
Source: Stockcharts.com
The CBOE Volatility Index (VIX), a measure of fear, has been trading above 20.00 for most of 2022. In late January, VIX made a high at 31.96 on 1/26 (brown circle), on 3/1 at 33.32 (red circle), and peaked at 36.95 on 3/7 (blue circle), making a low on 4/1 at 18.57. VIX approached the low in August but has been rising since. VIX rose to closed at 26.3 (pink circle), above 24.00 (brown dotted line), which has been acting as resistance and support. Intra-day volatility will likely remain high as long as VIX closes above 24.00.
Figure 6: Daily New York Stock Exchange (NYSE) New Lows
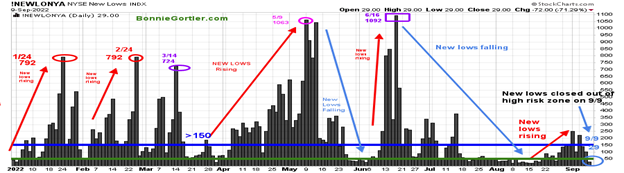
Source: Stockcharts.com
Watching new lows on the New York Stock Exchange is a simple technical tool that helps awareness of the immediate trend's direction. New lows warned of a potential sharp pullback, high volatility, and "panic selling" for most of 2022, closing above 150. As the market started to move lower in January 2022, new lows rose sharply, peaking at 792 on 1/24 and again on 2/24 (red circles), implying an increased risk of further selling pressure. Investors in early May unloaded stocks, and new lows expanded to 1063 on 5/9 (pink circle), then on 6/16 (purple rectangle), new lows made a new high of 1092.
Learn more about the significance of new lows in my book, Journey to Wealth, published on Amazon. Here is an excerpt when new lows are above 150, the market is negative, higher risk, and selling is taking place. Sometimes it could be severe, and sometimes on a very nasty day, you can have “panic selling,” and big wild swings (high volatility) to the downside may occur. After contracting in June and July, new lows began to increase in mid-August, rising above 150 (blue horizontal line), the high-risk zone. New lows on the New York Stock Exchange Index (NYSE) rose sharply last week, shifting to the high-risk zone, above 150, closing at 362 on 9/16 (pink circle). Watch next week if new lows expand, which would be bearish, or begin to contract and fall below 150, then fall to between 25 and 50, indicating lower risk and a sign of a potential short-term rally.
Figure 7: Daily iShares Russell 2000 (IWM) Price (Top) and 12-26-9 MACD (Bottom)
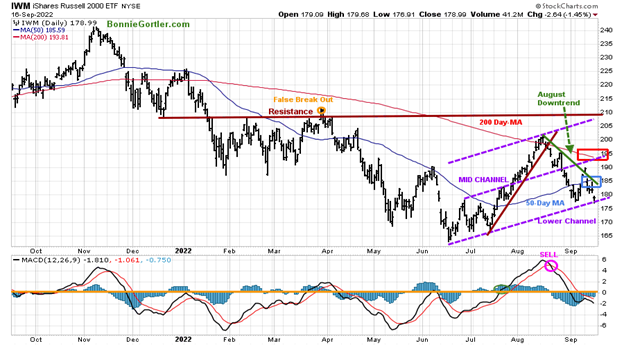
Source: Stockcharts.com
The top portion of the chart is the daily iShares Russell 2000 Index ETF (IWM), the benchmark for small-cap stocks, with a 50-Day Moving Average (MA) (blue line) and 200-Day Moving Average (MA) that traders watch and use to define trends. At the end of March, IWM failed to break out above resistance at 210.00 (orange circle) and turned lower with few rallies since the June bottom that have been unsustainable.
IWM closed at 178.99, down -4.49 %, giving back all of the previous week's gains. Its negative IWM closed below the 50-Day Moving Average (blue rectangle) and the 200-Day Moving Average (red rectangle), a sign of underlying weakness. IWM stalled below the mid-channel (middle purple dotted line) at 190.00 and fell toward the lower channel support at 175.00 with a low of 176.91. Short-term resistance is 185.00, 190.00, and 195.00. A close below 175.00, the lower channel this week, would suggest further downside toward the June low.
MACD (middle chart) remains on a sell after a brief turn-up and is falling, implying more downside momentum. The short term is negative unless a turn-up with a close above 185.00.
Figure 8: Weekly iShares Russell 2000 (IWM) Price (Top) and 12-26-9 MACD (Bottom)
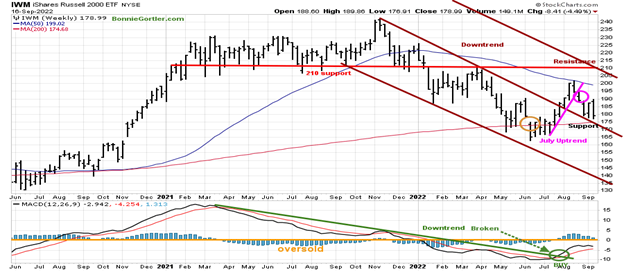
Source: Stockcharts.com
The Russell 2000 (IWM) closed stalled below the 50-Week Moving Average and then turned down, breaking the intermediate July uptrend. Last week IWM made a slightly higher high and turned down but closed near its lows. Support remains at 175.00, and resistance is at 190.00, 195.00, 200.00, and 210.00.
MACD (bottom chart) remains on a buy (green circle) along with breaking the downtrend from March 2021 (green line), implying the downside momentum has subsided. However, it’s concerning MACD has turned down and has failed to get above zero, which is a sign of underlying weakness.
In Sum
IWM held support at 175.00, above its 200-Week MA and above the June low. However, more strength in IWM is necessary for evidence that the decline will not continue towards the June low.
Figure 9: Daily Invesco QQQ Trust (QQQ) Price (Top) and 12-26-9 MACD (Bottom)
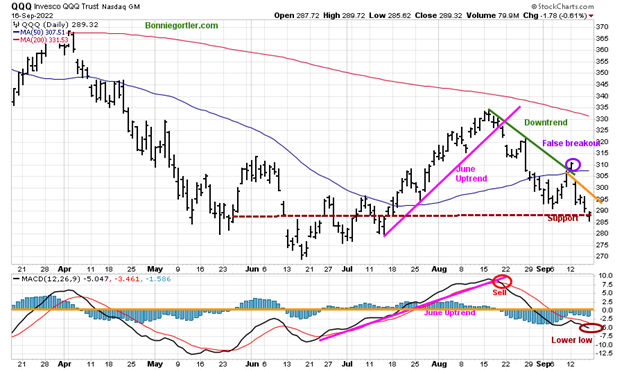
Source: Stockcharts.com
The chart shows the daily Invesco QQQ (QQQ), an exchange-traded fund based on the Nasdaq 100 Index. The two top holdings in QQQ are Apple (AAPL) and Microsoft (MSFT), with over 20.00%. The direction of both these stocks will impact the direction of QQQ. QQQ sold off sharply, falling -5.79%, closing at 289.32, slightly under support at 290.00 after a false break out of the August downtrend (green line). Support is at 285.00, 280.00, and 270.00. Resistance is at 295.00, 300.00, and 305.00. The bottom chart is MACD (12, 26, 9), a measure of momentum that remains on a sell. It’s a negative sign that momentum continued to weaken with the heavy selling last week. MACD made a new low suggestion caution in the near term. Bottom fishing in the Nasdaq is a high risk until at least QQQ closes above the first resistance at 295.00.
Follow up on previous speculative buy.
Figure 10: Weekly Invesco Agriculture Fund (DBA) (High Risk) Price (Top) and 12-26-9 MACD (Middle) and Money Flow (Bottom)
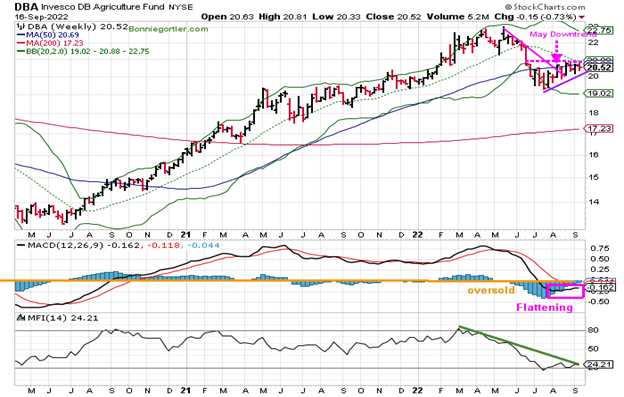
Source: Stockcharts.com
The Invesco Agricultural Fund (DBA) broke the steep May downtrend (pink line) but stalled and is in a trading range. DBA fell -0.73 % last week, closing at 20.52. MACD, a measure of momentum, is on a sell, with no real strength yet, which is a little concerning. Money flow is rising but remains in a downtrend for now.
For those of you who did buy, as mentioned on the 8/12 market update to manage risk, continue keeping a tight stop if you invested in DBA and close your position (sell stop) if DBA closes below 19.80. The low was 19.87 on 8/19. I am looking for a breakout of the current trading range within one-three weeks as the 12-14 week cycle is likely to bottom. If Money flow continues to rise, the breakout likely is to the upside. On the other hand, if Money flow begins to fall and the DBA uptrend is violated, the breakout will be to the downside. Time will tell. Continue to follow the stop.
Figure 11: Energy SPDR Daily (XLE)
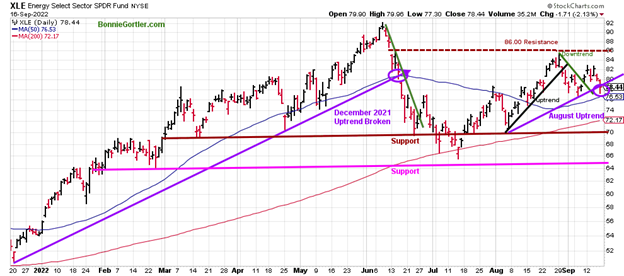
Source: Stockcharts.com
Energy, the strongest sector of 2022, rose in early August, forming an uptrend after its pullback from the June highs.XLE fell - 2.68% last week. It's positive that XLE closed above the 50 and 200-Day Moving Averages. However, it’s concerning XLE has formed a pattern of lower highs and broke the August uptrend. The strength of each rally is weakening, so caution is recommended in this sector unless XLE closes above 83.00. Resistance is at 83.00 and 86.00. Support is at 76.00 and 70.00 (brown line), followed by 65.00 (pink line).
Figure 12: The S&P 500 Index (SPX) Daily
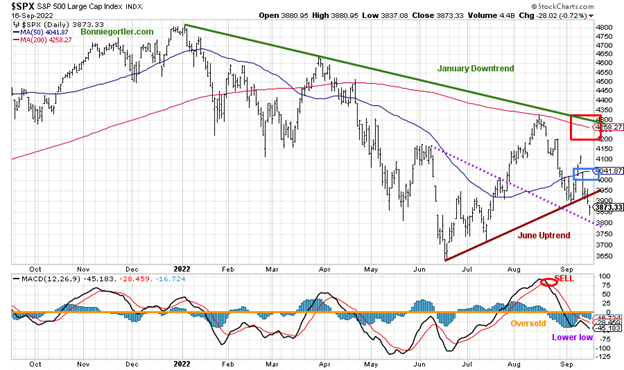
Source: Stockcharts.com
The S&P 500 fell -4.79%, closing at 3873.33, giving back its previous week's gains, and closed below support at 3900.00 and below the June uptrend (brown line) and its 50-Day Moving Average (blue rectangle) and the 200-Day Moving Average (red rectangle. The critical support is at 3800.00 (purple dotted line). It will be favorable if SPX has enough strength to close above 3950.00, followed by 4050.00 and 4200.00. MACD, lower chart, is oversold, below zero, and failed to give a buy last week after turning up. Instead, MACD made a new low, implying the SPX will likely have further downside toward the June low. The bottoming process continues, and the risk is high that more downside remains.
Monitor Junk Bonds For a Clue to Short-Term Direction
Figure 13: I Shares Hi Yield Corporate Bond (HYG) (Top), and 12-26-9 MACD (Bottom)
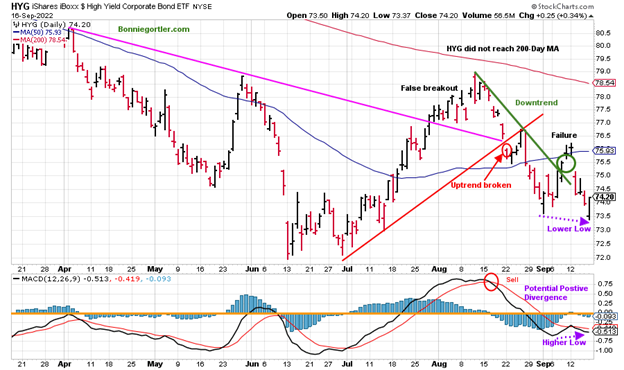
Source: Stockcharts.com
Last week, investors were unwilling to take on the risk, selling rather than buying Hi-Yield Bonds (HYG). Support is at 73.00. Resistance is at 74.50, 76.00, and 79.00. MACD (lower chart) remains on a sell, close to a buy signal if HYG shows strength. A potential positive divergence has formed. HYG made a lower low, and MACD had a higher low. Be alert to a turn-up in MACD generating a buy. Strength in HYG would be bullish for Equities and high-yield bonds. On the other hand, the opposite is true. Weakness in HYG would be bearish for Equities and high-yield bonds.
Figure 14: iShares Transportation Average (IYT) Price (Top) and 12-26-9 MACD (Bottom)
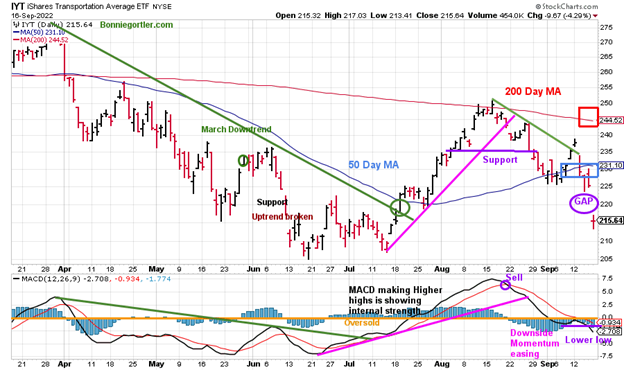
Source: Stockcharts.com
The Transportation Average (IYT) broke its price downtrend from March (green circle) in July and then consolidated near the 50-Day Moving Average before rallying toward the 200-Day MA and turned down. Selling continued in IYT after breaking the uptrend (pink line) in August and fell below support at 235.00 (purple line). Another rally attempt occurred in early September, after breaking the August downtrend but was unsuccessful. Last week IYT fell sharply, failing to get through resistance at 240.00 and a bad earnings report by Fed Ex (FDX). IYT gapped down below support at 225.00, closing at 215.64, falling -8.41% for the week. MACD remains on a sell, and downside momentum accelerated lower, making a new low.
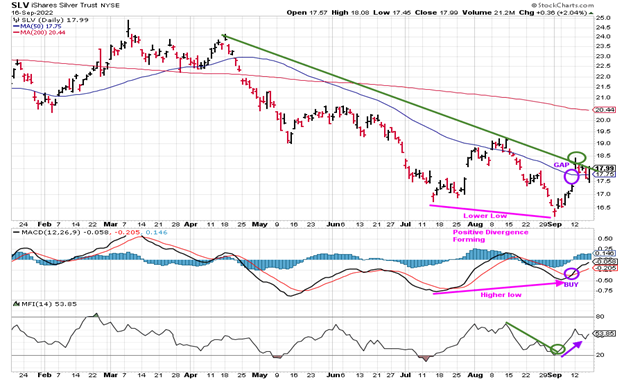
Aggressive Speculative Buy Follow-Up—Silver
Silver to breakout to the upside?
Figure 15: I Shares Silver Trust (SLV)
Source: Stockcharts.com
In the Market Update on 9/9/22, I suggested checking out the silver chart and noticing the positive divergence forming—a lower low in SLV with a higher low in MACD. A MACD buy will confirm.
Silver closed higher for the week, +3.87% breaking the downtrend from August, tested the breakout, filled the gap, and closed near its high of the day on Friday.
Money Flow rose sharply into the rise, breaking the downtrend (green line) followed by a pullback and turn up. Time will tell if Silver can follow through further and a sustainable rally. For those who bought, to manage risk, raise the sell stop to 16.87 from 16.14.
Summing Up
There was no follow-through to the upside last week as stocks reversed lower, with the S&P 500 and the Nasdaq having their largest weekly decline since June. Market breadth got worse, and downside momentum accelerated. The bears took control selling stocks as bulls went into hiding. Inflation concerns remain. Investors are waiting for an expected increase of at least 0.75% at Wednesday’s Federal Reserve meeting. The short term is dubious and indicates the downside may continue, and caution is prudent. There is no need to pick a bottom. Instead, be patient until market breadth improves and the short-term technical improves to participate in a lower-risk environment.
Remember to manage your risk, and your wealth will grow.
I would love to hear from you. If you have any questions or comments or would like to talk about the market, email me at Bonnie@Bonniegortler.com.
Disclaimer: Although the information is made with a sincere effort for accuracy, it is not guaranteed that the information provided is a statement of fact. Nor can we guarantee the results of following any of the recommendations made herein. Readers are encouraged to meet with their own advisors to consider the suitability of investments for their own particular situations and for determination of their own risk levels. Past performance does not guarantee any future results.


