

The pattern is clear enough with turns in the CBOE Volatility Index, or VIX, and equity market, states Jon Markman, editor of Strategic Advantage.
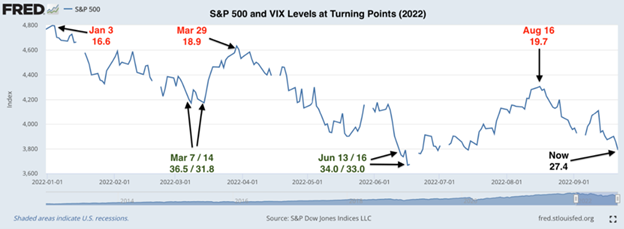
The S&P 500 (SPX) tops out when the Cboe SPX Volatility Index (VIX) is below 20 (early January, late March, mid-August) and bottoms when the VIX is in the low-to-mid 30s (early March, mid-June), as shown in the DTR chart below.
This fits with the long-run VIX statistics we occasionally discuss. The average daily VIX reading back to 1990 is 20 and the standard deviation around that mean is eight. Given higher than average macro uncertainty at present, it makes little sense for the VIX to trade at 20. Therefore, S&P 500 tops happen when it gets there.
Conversely, as we get beyond one standard deviation (28) and closer to two standard deviations (36), we know market uncertainty is statistically quite high. Near-term bottoms in the S&P 500 this year line up with such VIX levels.
That leaves us with a problem, however: a VIX at 29.92 at the end of last week is not consistent with a tradeable near-term low for US large caps. You’d think that between last week’s Fed meeting, ever higher interest rates, new lows on various non-US currencies, Russia-Ukraine, and other factors, we’d be at +30 on the VIX. But no. Not even close.
Takeaway: The VIX has been a reliable indicator of short-term highs and lows all year, so keep an eye on it in the weeks ahead. Current levels say we are in a no-man’s-land. Look for +30 readings before playing for a bounce or adding to longer-term equity positions.


