

Last week the major averages started with solid gains but ended on a sour note. Seven of 11 SPDR S&P 500 ETF Trust (SPY) sectors finished higher, notes Bonnie Gortler of bonniegortler.com.
Energy (XLE), the best sector for the year, was the strongest sector, while Utilities (XLU) and Real Estate (XLRE) were the worst. SPY rose +1.57%.
S&P SPDR Sector ETFs Performance Summary 9/30/22 – 10/7/22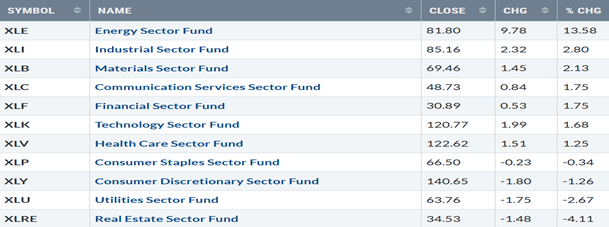
Source: Stockcharts.com
Figure 2: Bonnie's Mix of ETFs Performance Summary 9/30/22 – 10/7/22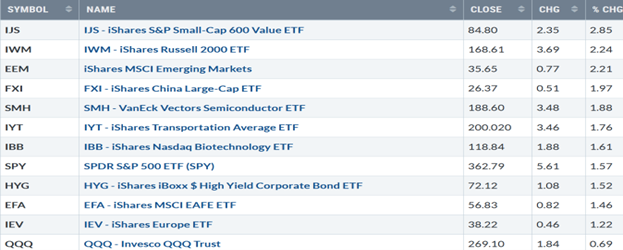
Source: Stockcharts.com
The market showed gains last week, but Friday’s close wasn't very reassuring after giving back most of the early week's gains. Stocks fell sharply on Friday after the September jobs report was reported stronger than expected as investors interpreted it as the Fed is likely to continue raising interest rates. Small-cap stocks, both value and growth, outperformed the S&P 500 (SPX).
Figure 3: Fear and Greed Index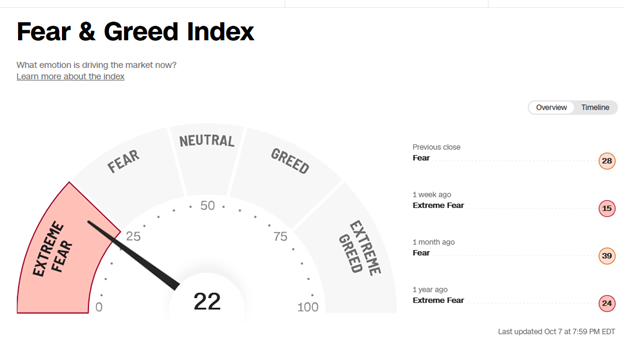
Source: Cnn.com
Even with the gains last week, extreme fear among investors remains. Market sentiment based on the CNBC Fear and Greed Index (a contrary indicator) rose to 22 after closing the previous week at 15.
The major averages were higher. The Dow was up +1.99%, S&P 500 gained +1.51%, and the Nasdaq was up 0.73%, the laggard for the week. The Russell 2000 Index led the major averages, gaining +2.25%, while the Value Line Arithmetic Index (a mix of approximately 1700 stocks gained +2.93%.
Weekly market breadth was positive on the New York Stock Exchange Index (NYSE) and Nasdaq. The NYSE had 2170 advances and 1328 declines, with 88 new highs and 867 new lows. There were 2173 advances and 3142 declines on the Nasdaq, with 146 new highs and 1767 new lows. Market breadth on the NYSE and Nasdaq needs to improve for a sustainable rally during the fourth quarter.
Figure 4: Nasdaq Advance-Decline Line (Daily) 2008-2022
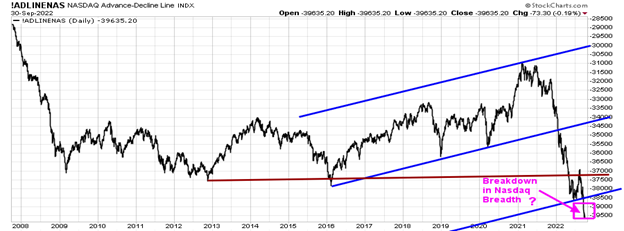
Source: Stockcharts.com
It’s concerning that Nasdaq breadth continues to make lower lows except for brief short-term rallies and now shows a breakdown (pink rectangle), falling to its lowest level since 2016.
Figure 5: Nasdaq Advance-Decline Line (Weekly) 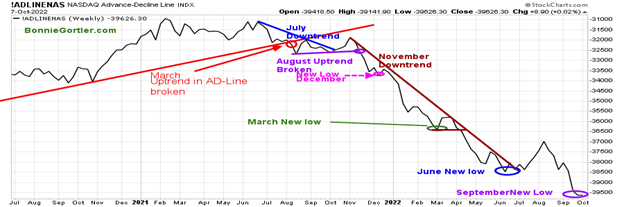
Source: Stockcharts.com
The March uptrend in the weekly Nasdaq Ad-Line was broken in July 2021 (red line), and then Nasdaq breadth weakened. In July 2022, market breadth improved, starting an uptrend in the AD-Line, but it was short-lived. In August, breadth weakened further, followed by new lows in September. Until breadth improves consistently, expect high volatility in Nasdaq. A cautious outlook is warranted before getting more aggressive. However, the best buying opportunities in Nasdaq stocks will occur in the future, which has not happened in years.
Figure 6: CBOE Volatility Index VIX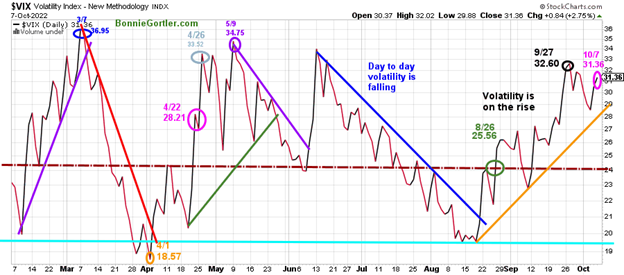
Source: Stockcharts.com
The CBOE Volatility Index (VIX), a measure of fear, has been trading above 20.00 for most of 2022. In late January, VIX made a high at 36.95 on 3/7 (blue circle), followed by a pullback to a low on 4/1 at 18.57. VIX approached the low in August but has trended higher since. VIX fell slightly last week, closing at 31.36 (pink circle), closing below the peak of 32.60 on 9/27. The next support area is 24.00 (brown dotted line), a previous resistance area. Intra-day volatility could remain high if the selling accelerates in the major averages if VIX remains above the uptrend at 28.00 (orange line). On the other hand, a close below 28.00 would be positive and likely for intraday volatility to slow.
Figure 7: Daily New York Stock Exchange (NYSE) new lows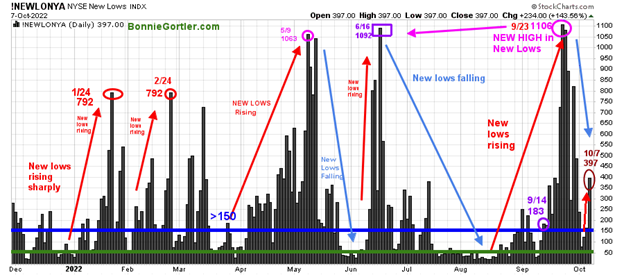
Source: Stockcharts.com
Watching new lows on the New York Stock Exchange is a simple technical tool that helps awareness of the immediate trend's direction. New lows warned of a potential sharp pullback, high volatility, and "panic selling" for most of 2022, closing above 150. As the market started to move lower in January 2022, new lows rose sharply, peaking at 792 on 1/24 and again on 2/24 (red circles), implying an increased risk of further selling pressure.
Investors in early May unloaded stocks with new lows expanding to 1063 on 5/9 (pink circle), then to a new high of 1092 on 6/16 (purple rectangle), which remained the newest lows until 9/23 when new lows made a new high of 1106. After new lows contracted in June and July, New lows began to increase in mid-August, rising above 150 (blue horizontal line), the high-risk zone. As a result, the broad market weakened.
After falling below, the high-risk zone to 78 on 10/4, new lows on the New York Stock Exchange Index (NYSE) increased and closed on 10/7 at 397 (brown circle), well below the peak of 1106 on 9/23 (pink circle). However, new lows ended last week no longer contracting and are above 150 and rising, closing in the high-risk zone. Caution is recommended until new lows contracts and falls below 150.
Figure 8: Daily iShares Russell 2000 (IWM) Price (Top) and 12-26-9 MACD (Bottom)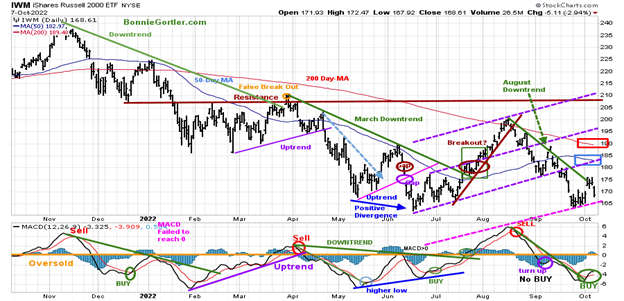
Source: Stockcharts.com
The top portion of the chart is the daily iShares Russell 2000 Index ETF (IWM), the benchmark for small-cap stocks, with a 50-day moving average (MA) (blue line) and 200-day moving average (MA) that traders watch and use to define trends. At the end of March, IWM failed to break out above resistance at 210.00 (orange circle) and turned lower with few rallies since the June bottom that have been unsustainable. IWM stalled below the mid-channel in early September (middle purple dotted line) at 190.00.
Last week IWM closed at 168.61, up +2.24%, closing above support at 165.00 but remaining below Its 50-day moving average (blue rectangle) and the 200-day moving average (red rectangle), a sign of underlying weakness. It’s positive that IWM was stronger than the S&P 500 last week. Short-term resistance is 173.00, 177.00, 180.00, and 190.00. Support is at 165.00 and 163.00. A close below 163.00 would imply a continuation of the decline with a potential downside toward 150.00.
MACD (middle chart) flipped to a buy, and it’s positive the August downtrend was penetrated, implying the thrust of the downside momentum is likely complete. In sum, IWM rose sharply early in the week, unable to hold onto all its gains. Instead, IWM turned down closing on Friday near its low. If IWM can outperform the SPY and close above 173.00, the odds favor IWM rallies towards 180.00.
Figure 9: Daily Invesco QQQ Trust (QQQ) Price (Top) and 12-26-9 MACD (Bottom)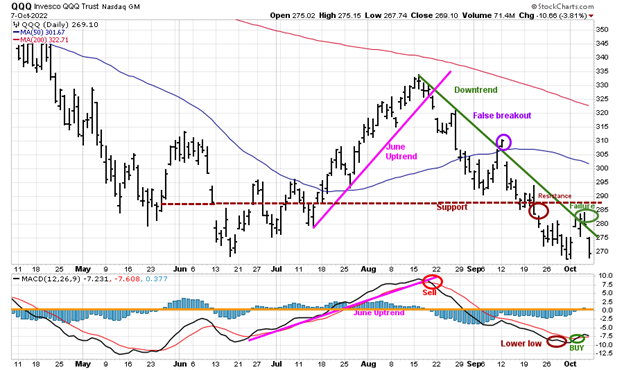
Source: Stockcharts.com
The chart shows the Daily Invesco QQQ Trust (QQQ), an exchange-traded fund based on the Nasdaq 100 Index. The two top holdings in QQQ are Apple (AAPL) and Microsoft (MSFT), with over 20.00%. Both stocks have fallen significantly and impacted the direction of QQQ. QQQ continued lower after a false breakout (purple circle) in September of the August downtrend (green line). Last week another rally attempt in QQQ appeared to have failed after not getting through overhead resistance despite breaking the August downtrend (green line).
QQQ, after a promising start to the week, closed with a slight gain of +0.69% at 269.10. Support is 265.00, with a downside target of 250.00. Resistance is at 275.00, 285.00, 290.00, and 300.00.
The bottom chart is MACD (12, 26, 9), a measure of momentum generated a buy last week. For now, the QQQ looks like the latest rally may have failed, and more downside remains. However, if QQQ closes above resistance at 275.00, and if Apple (AAPL and Microsoft, the largest holdings in QQQ, rise, then another rally attempt in QQQ towards 285.00 is likely.
Figure 10: Apple, Inc (AAPL) Price (Top) and 12-26-9 MACD (Middle) and Money Flow (Bottom)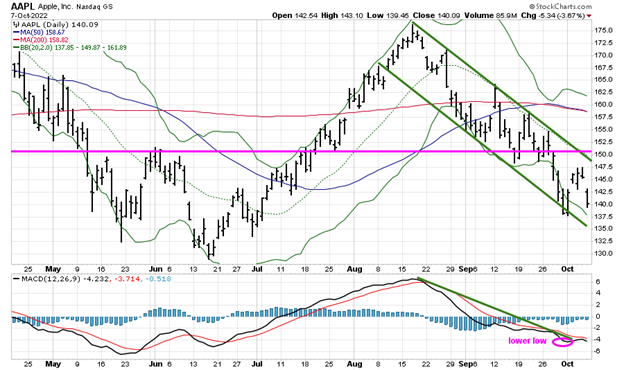
Source: Stockcharts.com
After reaching its downside object Apple, the biggest holding in QQQ, last week, gained +1.37% for the week remaining in a downtrend and closing below its 50- and 200-day moving average. MACD, a measure of momentum (lower chart), remains on a sell, continues to be oversold, below 0, and has weak momentum. A potential test of the June lows remains possible if AAPL closes below 135.00. On the other hand, a close above 148.00 and then 150 would be positive and likely attract more buying.
Figure 11: Energy SPDR Daily (XLE)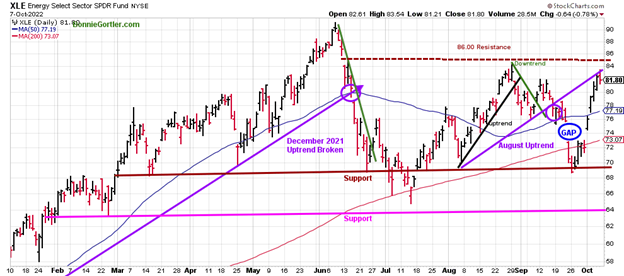
Source: Stockcharts.com
Energy rose in early August, forming an uptrend after its pullback from the June highs. Last week XLE rose sharply +13.58%, filling the gap (blue circle), penetrating previous resistance at 73.00, 76.00, and 80.00 and closing above the 50 and the 200-day MA at 81.90. Resistance is at 84.00 and 86.00. Support is at 80.00, 76.00, and 70.00 (brown line), followed by 64.00 (pink line). XLE will remain a hot sector until proven otherwise.
Figure 12: The S&P 500 Index ($SPX) Daily and 12-26-9 MACD (Bottom)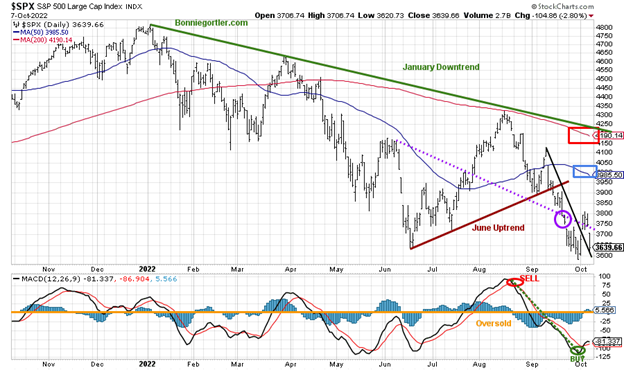
Source: Stockcharts.com
The SPX broke below the critical support at 3800.00 (purple dotted line, and then accelerated lower (purple circle) after breaking the June uptrend (brown line). SPX closed at 3639.66, up +1.51. % and remains below its 50-day moving average (blue rectangle) and the 200-day moving average (red rectangle).
MACD, lower chart, generated a new buy (green circle) and broke its August downside trend line (green dotted line), implying downside momentum has slowed. SPX had enough strength to break the short-term downtrend (black line) and close above 3750.00, but there was no follow-through, and SPX turned lower. The bottoming process continues, and the risk of more downside remains. However, another rally is possible in the short term if SPX closes above the September low. If you are interested in following this chart and other charts during the week, I invite you to join my FB group Wealth Through Market Charts, where you will find updated charts intraday.
Follow-Up – Silver
Figure 13: iShares Silver Trust (SLV) and 12-26-9 MACD (Bottom)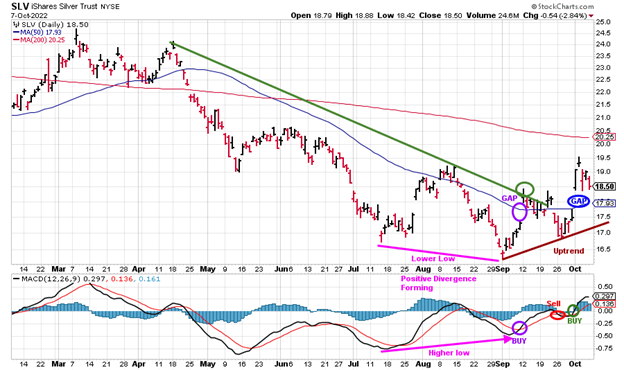
Source: Stockcharts.com
iShares Silver Trust (SLV) gained +5.71%, closing at 18.50 after starting the week, gapping sharply higher, and then pulled back to close near where it opened. MACD (bottom chart) had a whipsaw giving a sell the previous week but flipped back on a buy. Close out your position if SLV closes below 16.87.
Monitor Junk Bonds (HYG) for a clue to short-term direction.
Figure 14: I Shares Hi Yield Corporate Bond (HYG) (Top), and 12-26-9 MACD (Bottom) 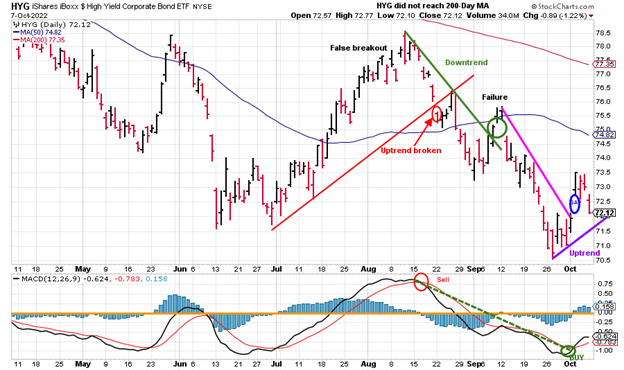
Investors started the week willing to take on the risk, buying hi-yield bonds, but ended the week selling before the weekend, not wanting additional risk over the weekend with the bond market closed on Monday, 10/10/22. The September uptrend (purple line) remains in effect, which is positive. On the other hand, it’s concerning HYG remains below the 50- and 200-day MA, a sign of underlying weakness.
MACD (bottom chart) gave a new buy and broke the August downtrend, implying the downside momentum has slowed. Strength in HYG would be bullish for equities and high-yield bonds. On the other hand, the opposite is true. Weakness in HYG would be bearish for equities and high-yield bonds. Continue to keep an eye on the strength of global markets.
Figure 15: Daily Vanguard FTSE All-World Index ex-US (VEU),12-26-9 MACD (Bottom)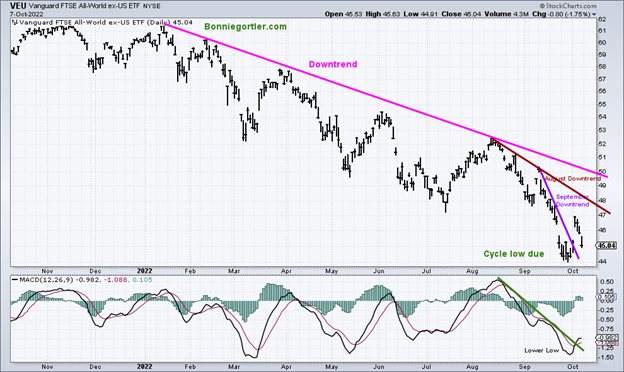
Vanguard FTSE All-World Index ex-US (VEU) comprises developed and emerging non-US equity markets around the world. The 2022 downtrend remains in effect (pink line). VEU broke the September short-term downtrend. MACD generated a buy, and the August downtrend was broken, implying downside momentum has slowed. Time will tell if the retracement of the breakout of the September downtrend will be the start of a move to the upside, or if the longer-term downtrends will prevail.
Summing Up:
A volatile week both up and down. Uncertainty remains about economic concerns and rising interest rates. The bulls showed up early in the week, but the bears took control before the weekend. Short-term momentum indicators have improved, implying downside momentum has slowed. However, there is no follow-through once a rally starts, and it fades quickly. A great buying opportunity is developing in equities and bonds, but for now, the bottom process continues, and it remains a challenging time.
Remember to manage your risk, and your wealth will grow.
I would love to hear from you. If you have any questions or comments or would like to talk about the market email me at email me at Bonnie@Bonniegortler.com.
Disclaimer: Although the information is made with a sincere effort for accuracy, it is not guaranteed that the information provided is a statement of fact. Nor can we guarantee the results of following any of the recommendations made herein. Readers are encouraged to meet with their own advisors to consider the suitability of investments for their own particular situations and for determination of their own risk levels. Past performance does not guarantee any future results.


