

The Fed isn’t likely to stop raising rates anytime soon which means cash is starting to become a viable competitor to the increasingly volatile trading in stocks and bonds, states Joe Duarte, editor of In the Money Options.
Moreover, liquidity is now reaching very dangerous levels. See below for details on both the allure of cash and the worsening liquidity situation.
What it all adds up to is a likely increase in volatility and increased vulnerability for markets when the inevitable pre-election October surprise arrives. If I was a betting man (I am), I would put my money on some dramatic development in the energy market.
The White House has already hinted that it would do something to lower gasoline prices and that it would announce it the week of 10/17/22. Be prepared for just about anything. But the chatter suggests we may hear about price controls, the banning of fuel exports, and/or more aggressive releases from the Strategic Petroleum Reserves.
We’re Not There Yet
The recent spate of economic numbers, a bad PPI, a worse CPI, a stronger than expected employment report, no evidence of rolling over in jobless claims, and no major negative earnings surprises other than pre-announcements by FedEx (FDX), so far, suggest that the Fed will just keep on trucking—at least until they run the stock market into the ground and the economy quickly follows.
The problem for the Fed, as familiar readers are aware, is that this bout of inflation is related to macro issues that are beyond their control—supply chain and other infrastructure-related problems. Thus, they really can’t be addressed adequately by the usual central bank measures: adjusting interest rates and influencing the money supply.
So, no matter how hard they try, inflation won’t come down unless the economy screeches to a halt. That’s going to be difficult when the sunbelt is a beehive of activity these days as more people leave high-tax, high-crime areas and move south.
Moreover, this bout of inflation is due to an imbalance between the supply and demand of goods caused by the decades-long trends related to globalization, the offshoring of US jobs, and the subsequent reduction in the US manufacturing base.
The net effect has been that there aren’t enough goods available to meet consumer demand. As a result, prices have risen. That the Fed pumped trillions into the economy during Covid-19 just made the situation more obvious.
So, what’s the answer? In the short term, it will pay to invest in sectors in which the supply and demand equation is in favor of the business. In the longer term, it will be profitable to invest in areas of the market where companies have made the necessary adjustments required to make money in a world where regional markets will outperform the global system.
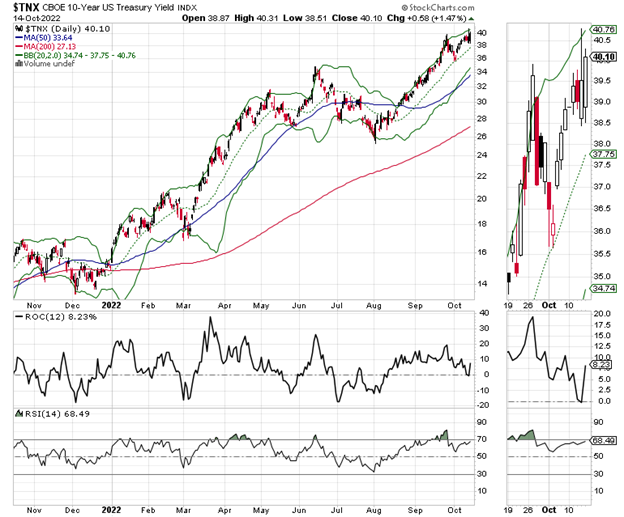
Cash Is Looking Good as Bonds Break to New High Yields
The US Ten-Year Note Yield (TNX) crossed the 4% point, a sign that investors are not interested in owning US debt at these levels and that the Fed keeps selling bonds to reduce the amount of money in circulation.
Meanwhile, the US Two-Year Note yield is nearing the 4.5% yield area, as US 90-day Treasury bills approach 4%.
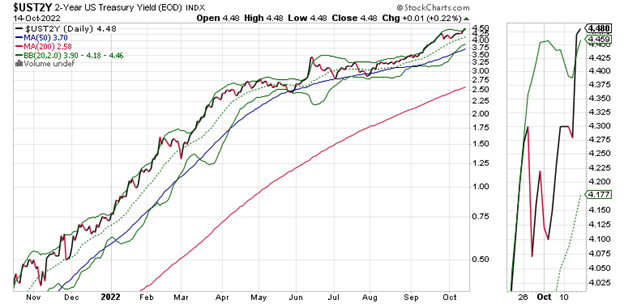
The upshot is that it’s becoming more attractive to hold cash at a nearly 4% yield in the safety of T-bills than to expose a portfolio to the daily whipsaws in stocks. As more investors figure this out, it is likely that we will see more selling in stocks.
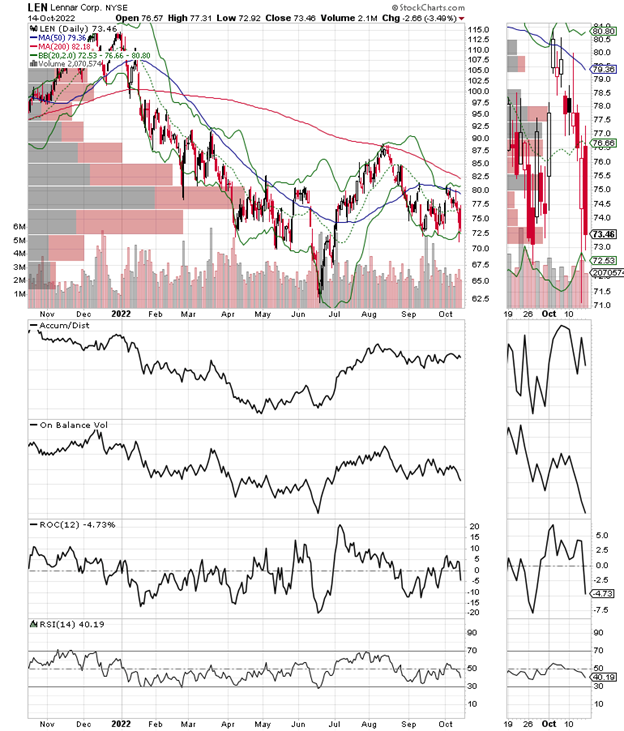
Supply and Demand Make Long-Term Play in Homebuilders Interesting
I’ve been bullish on the homebuilder sector for a long time. That’s because the supply and demand equation in the housing sector remains in favor of the homebuilders. And I remain bullish even though the stocks of many companies in the sector are near their recent lows.
But it’s hard to be bullish as mortgage rates continue to rise. And the move above the 4% yield by the US Ten-Year note won’t help. Interestingly, because the supply of available homes for sale, new and existing, is still low and there is such a relocation factor to the sunbelt, those who are buying are trending toward the old Adjustable Rate Mortgages (ARMS).
This, of course, could help in the short term as homebuilders can lock in more sales and existing homes may find buyers where they otherwise might not be due to rates creeping up well above 6%.
The downside is that when these mortgages reset, they could lead to defaults if interest rates are higher than when they originated. This was part of the problem in 2008 when the subprime mortgage crisis erupted, and the foreclosure crisis followed.
In certain areas of my neck of the woods, the Dallas Fort Worth metroplex, new homes are being built at a moderately brisk pace. Meanwhile, existing homes are selling at lower prices and staying on the market longer.
But because of the supply-demand scenario, due to the migration from other states, the market here is still functioning and even growing, albeit at a slower pace than 12-18 months ago. The real question is how much of an effect the economic activity in the sunbelt will have on the homebuilders as earnings season develops.
Shares of leading homebuilder Lennar (LEN) are off of their worse levels for the year. Moreover, every time bond yields fall, even for a few days, the shares pop higher. This is actually a bullish sign as it suggests that when the Fed is finally done raising rates, the homebuilders are likely to move higher.
Accumulation Distribution (ADI) is essentially neutral which is a good sign suggesting short sellers have better places to ply their wares. On Balance Volume (OBV) is a bit on the weak side, which suggests that buyers aren’t quite moving in aggressively yet.
For long-term investors, however, the homebuilders which are trading at bargain P/E ratios, such as four for Lennar, the shares may be worth nibbling at. Lennar reports earnings on 12/15/22. Last quarter it grew its earnings at a 58% year-over-year rate.
I own shares in Lennar and have added to my position modestly on recent dips.
Little Change in Breadth and Liquidity Suggests More of the Same
Despite the one-day melt-up in stocks on 10/13, we saw no follow-through. That suggests that the buyers are gone. The short sellers are back in control. And with liquidity drying up, we may not see any major change in the stock market’s trend for a while.
The New York Stock Exchange Advance Decline line (NYAD) made a new low to end the week as the CBOE Volatility Index (VIX) resumed its uptrend.
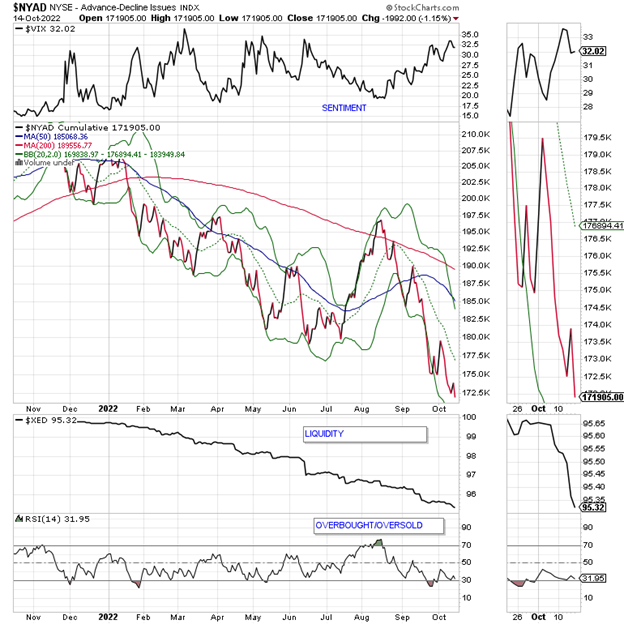
Rising put option volume (rising VIX) leads market makers to sell stock index futures and increases the selling pressure on a market which is being talked down by the Federal Reserve and where liquidity is almost non-existent.
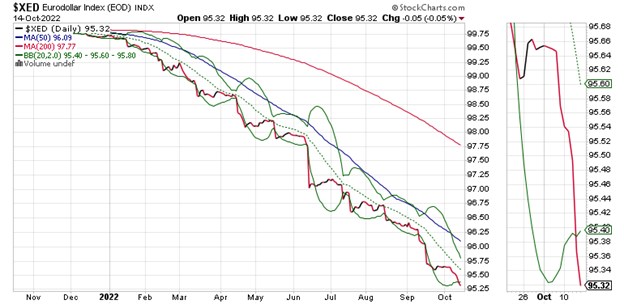
The lack of liquidity is best seen in the new lows delivered by the Eurodollar Index. No liquidity means not enough money in the market to follow through on short covering rallies as we saw on 10/13/22. Interestingly, the Eurodollar Index has fallen below its lower Bollinger Band. That means that the decline in liquidity is now well beyond what is considered normal. Under normal circumstances, in a normally functioning market, the Eurodollar Index would rise and move back inside the bands, at least in the short term.
But this is not a functional market, so we’ll have to see how things develop.
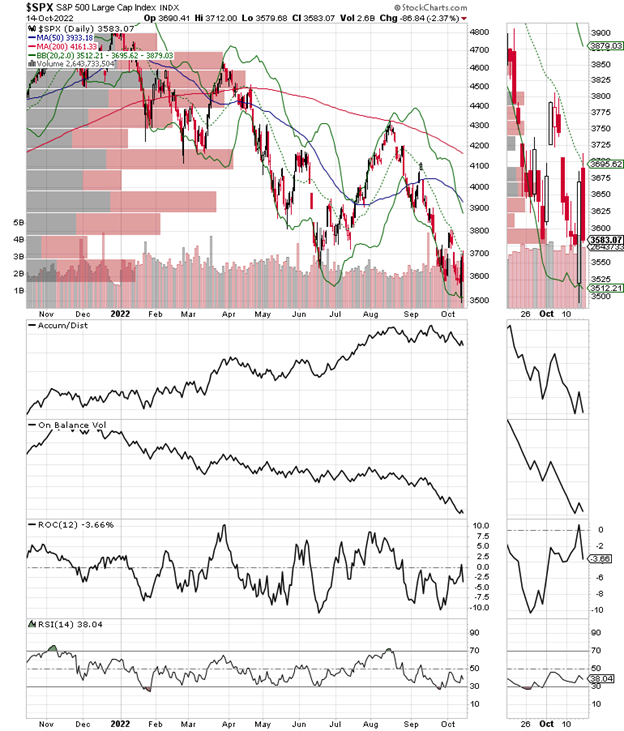
The S&P 500 (SPX) again broke below 3600 while failing to rally above 3700. Accumulation Distribution (ADI) and On Balance Volume (OBV) are both heading down reports as short sellers dig in forcing buyers to become sellers.
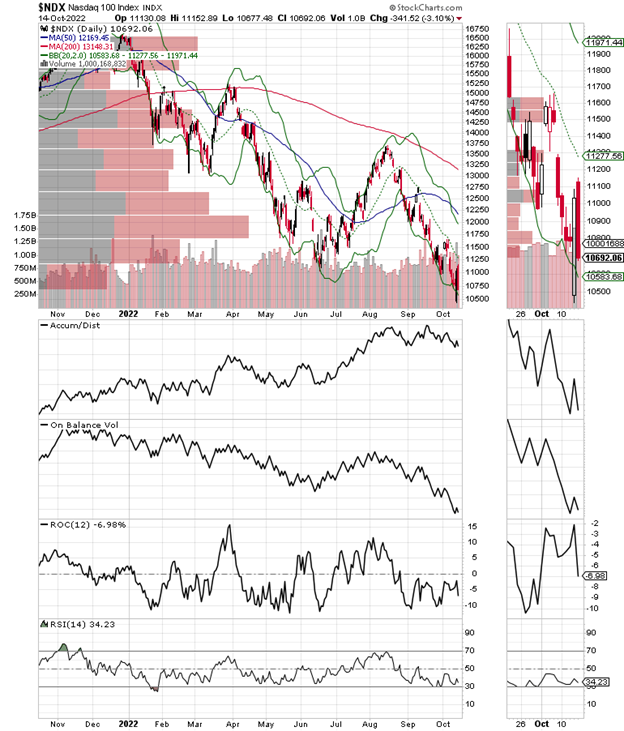
The Nasdaq 100 Index (NDX) remains a wasteland with the 11,000 price area remaining at a tough resistance level.
To learn more about Joe Duarte, please visit JoeDuarteintheMoneyOptions.com.


