
For today’s trade of the day we will be looking at a monthly chart for Cloudflare, Inc. (NET), states Chuck Hughes of TradeWinsDaily.
Before breaking down NET’s monthly chart let’s first review what products and services the company offers.
CloudFlare, Inc. operates as a cloud services provider that delivers a range of services to businesses worldwide. The company offers an integrated cloud-based security solution to secure a range of combinations of platforms, including public cloud, private cloud, on-premise, software-as-a-service applications, and IoT devices. Its security products comprise cloud firewall, bot management, distributed denial of service, IoT, SSL/TLS, secure origin connection, and rate limiting products.
Now, let’s begin to break down the monthly chart for NET stock. Below is a Ten-Month Simple Moving Average chart for Cloudflare, Inc.

Sell NET Stock
As the chart shows, in January, the NET 1-Month Price, crossed below the 10-Month simple moving average (SMA). This crossover indicated the selling pressure for NET stock exceeded the buying pressure. For this kind of crossover to occur, a stock has to be in a strong bearish downtrend.
Now, as you can see, the One-Month Price is still below the Ten-Month SMA. That means the bearish trend is still in play! As long as the One-Month price remains below the Ten-Month SMA, the stock is more likely to keep trading at new lows and bearish positions should be initiated. Our initial price target for NET is 41.00 per share.
Profit if NET Is Down, Up, or Flat
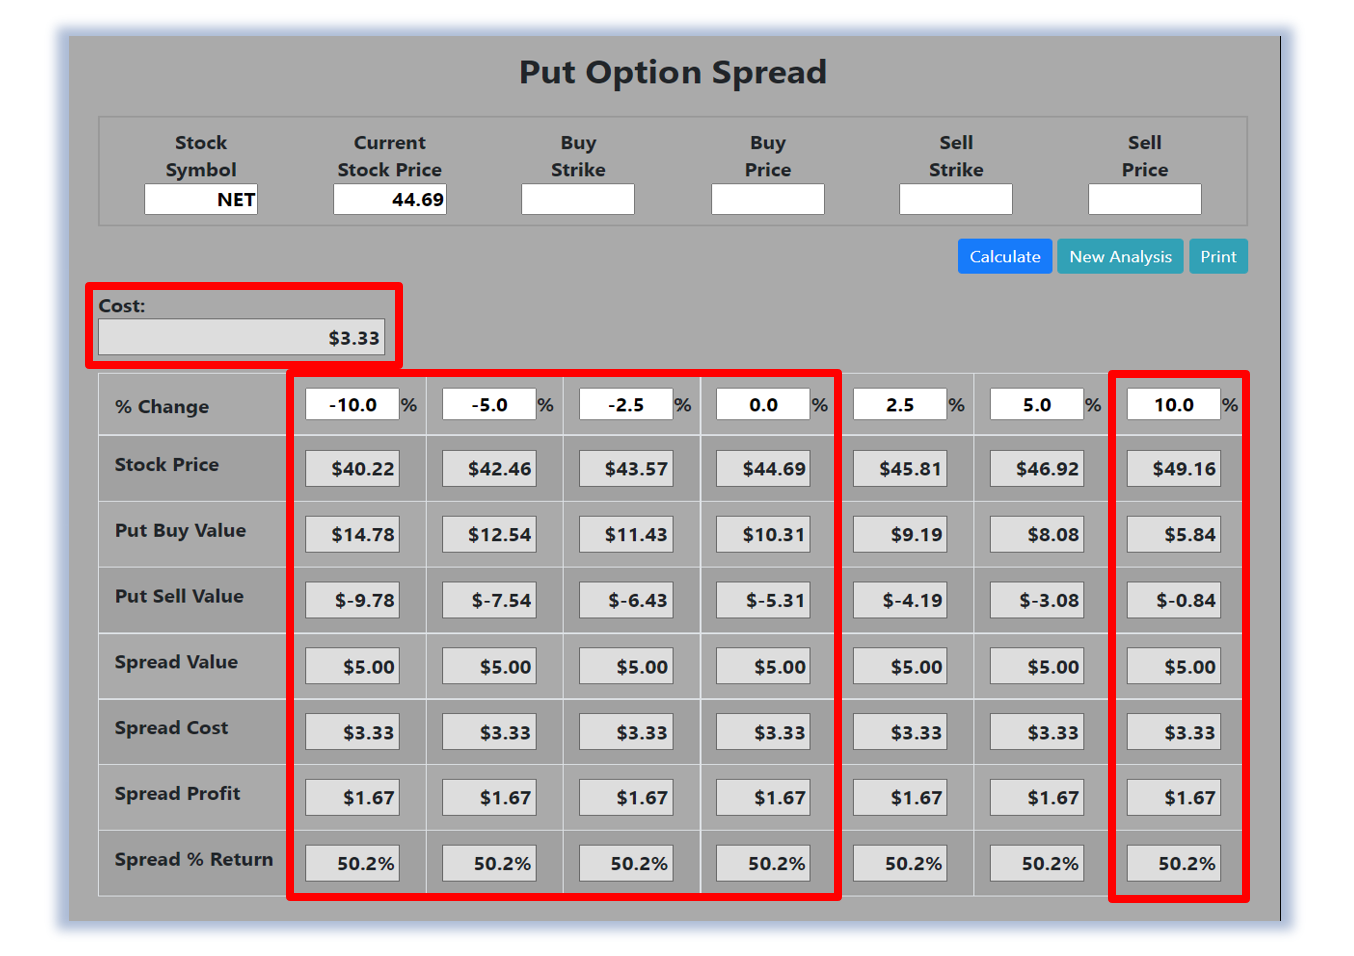
Now, since NET’s One-Month Price is trading below the Ten-Month SMA, the stock will likely continue its trend downward. Let’s use the Hughes Optioneering calculator to look at the potential returns for a NET put option spread. The Put Option Spread Calculator will calculate the profit/loss potential for a put option spread based on the price change of the underlying stock/ETF at option expiration in this example from a 10.0% decrease to a 10.0% increase in NET stock at option expiration.
The goal of this example is to demonstrate the ‘built-in’ profit potential for option spreads and the ability of spreads to profit if the underlying stock is down, up, or flat at option expiration. Out of fairness to our paid option service subscribers, we don’t list the option strike prices used in the profit/loss calculation. The prices and returns represented below were calculated based on the current stock and option pricing for NET on 11/21/2022 before commissions.
Built-in Profit Potential
For this option spread, the calculator analysis below reveals the cost of the spread is $333 (circled). The maximum risk for an option spread is the cost of the spread. The analysis reveals that if NET stock is flat or down at all at expiration the spread will realize a 50.2% return (circled). And if NET stock increases 10.0% at option expiration, the option spread would make a 50.2% return (circled).
Due to option pricing characteristics, this option spread has a ‘built-in’ 50.2% profit potential when the trade was identified*. Option spread trades can result in a higher percentage of winning trades compared to a directional option trade if you can profit when the underlying stock/ETF is up, down, or flat. A higher percentage of winning trades can give you the discipline needed to become a successful trader.
The Hughes Optioneering Team is here to help you identify profit opportunities just like this one.