

Investors were in the holiday spirit last week buying stocks, notes Bonnie Gortler of bonniegortler.com.
All eleven S&P SPDR sectors were higher. Utilities (XLU) and Materials (XLB) were the strongest, while Technology (XLK) and Energy (XLE) were the weakest. The SPDR S&P 500 ETF Trust (SPY) gained +1.59%.
S&P SPDR Sector ETFs Performance Summary
11/18/22 – 11/25/22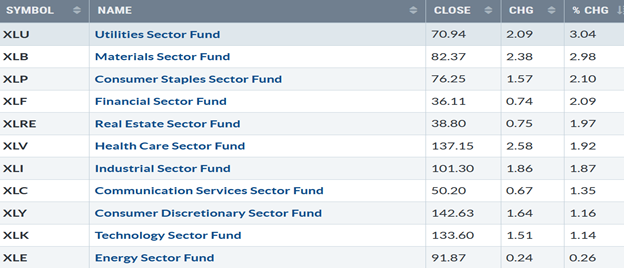
Source: Stockcharts.com
Figure 2: Bonnie's Mix of ETFs
Performance Summary 11/18/22 – 11/25/22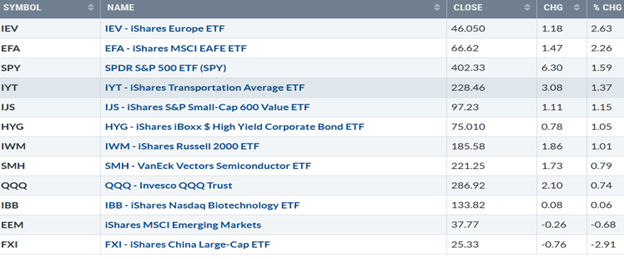
Source: Stockcharts.com
Europe and EFA, large and mid-cap stocks across Developed Markets countries worldwide, excluding the US and Canada, have come to life, while China lagged. Small Cap Growth and Transportation were higher but weaker than the S&P 500.
Figure 3: S&P SPY Sectors
Performance 12/31/21 – 11/25/22
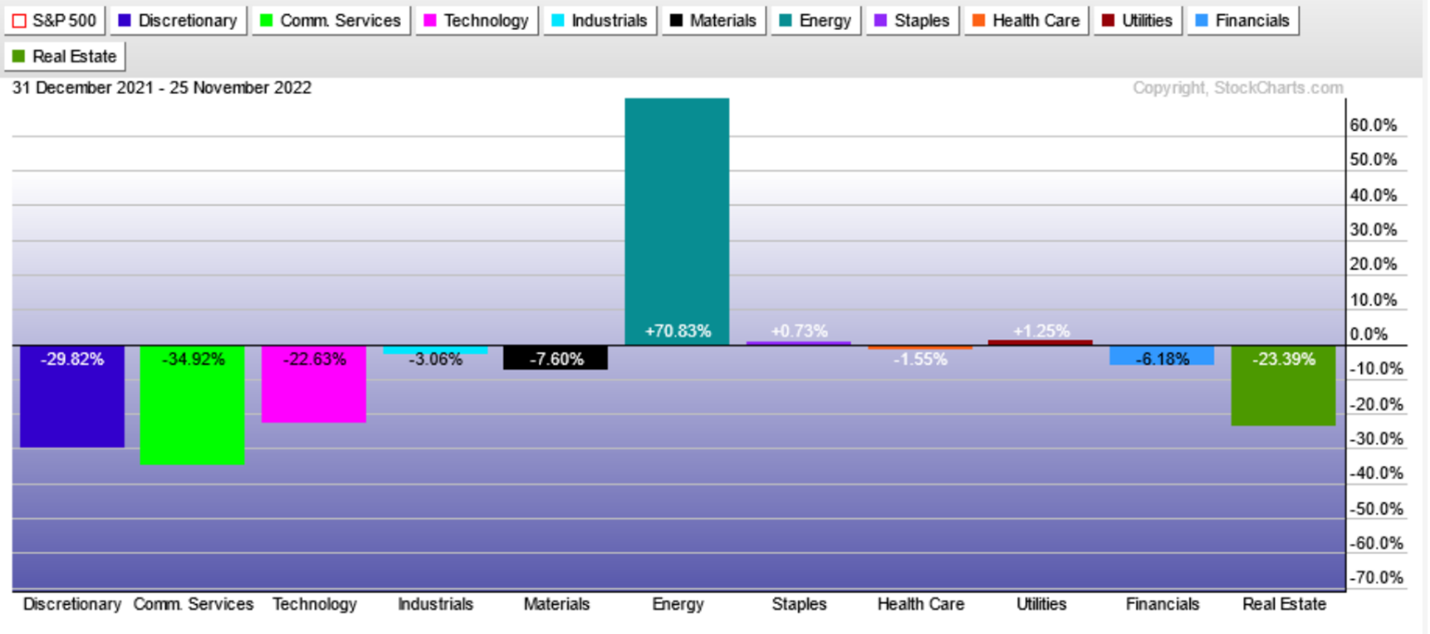 Source: Stockcharts.com
The best SPY Sector in 2022 through 11/25 is Energy (XLE), while the worst is Communication Services (XLC).
Figure 4: Fear and Greed Index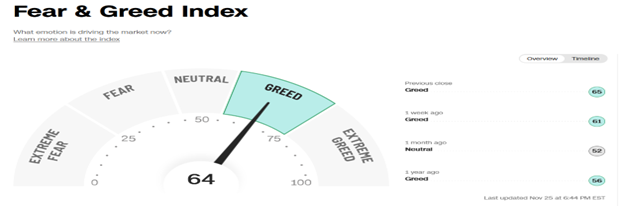
Source CNBC
Market sentiment based on the CNBC Fear and Greed Index (a contrary indicator) rose last week to 64, still showing greed. The easy money is over. The sentiment shows increased risk but will likely go to extreme greed in the next several weeks before a correction begins.
Figure 5: EFA iShares MSCI EAFE (Daily)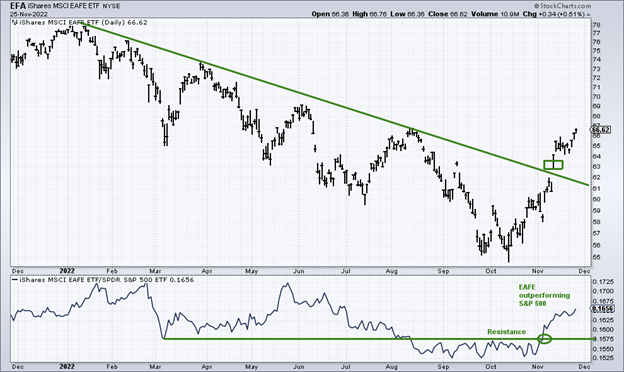
Source: Stockcharts.com
The top chart is EFA Ishares MSCI ETF, a broad market index of stocks located within countries in Europe, Australasia, and the Middle East. It includes Large and Mid-cap stocks across Developed Markets countries worldwide, excluding the US and Canada. EFA broke the 2022 downtrend on 11/10/22 and is gaining relative strength.
The bottom chart is the relative strength ratio of EFA/SPY. EFA is stronger than the S&P 500, which helps international stocks, which have lagged U.S. equities for over a decade. Further gains would help retirement plans with a high percentage allocated.
Figure 6: UST 10YR Bond Yields Daily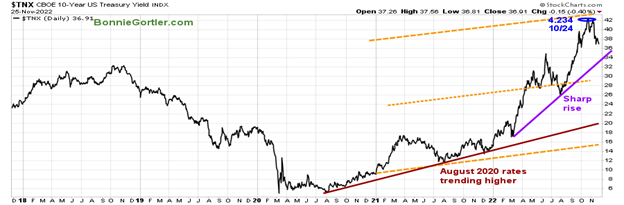
Source: Stockcharts.com
The 10-Year U.S. Treasury yields fell, closing at 3.691% remaining below the high made on 10/24 of 4.234% and below the upper channel objective. Support is at 3.400%. It is favorable for stocks in the short term if yields continue to decline. On the other hand, yields rising above the channel would likely put pressure on growth stocks with no earnings and borrowing money.
The major averages were all higher last week. The Dow gained +1.78%, S&P 500 up +1.53%, and the Nasdaq rose +0.72%, continuing weaker than both the Dow and S&P 500, which is concerning. The Russell 2000 Index rose +1.05%, and the Value Line Arithmetic Index (a mix of approximately 1700 stocks) gained +1.69%.
Figure 7: Nasdaq, New York Index, Dow Jones Industrial, and S&P 500 $COMPQ,$NYA,$INDU,$SPX
Performance 12/31/21 – 11/25/22
Source: Stockcharts.com
The Dow is the best average in 2022, while Nasdaq is the worst. Weekly market breadth was positive on the New York Stock Exchange Index (NYSE) and Nasdaq. The NYSE had 2426 advances and 935 declines, with 189 new highs and 136 new lows. There were 3107 advances and 2138 declines on the Nasdaq, with 343 new highs and 531 new lows. Continued positive breadth would be a bullish sign for further gains in the short term for the major averages. Watch if New Highs in Nasdaq and New York start to expand while New lows contract.
Figure 8: CBOE Volatility Index VIX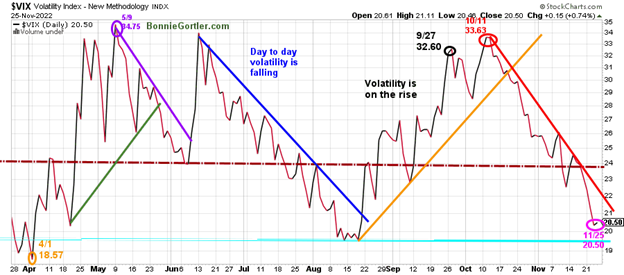
Source: Stockcharts.com
The CBOE Volatility Index (VIX), a measure of fear, has been trading above 20.00 for most of 2022. In late January, VIX peaked at 36.95 on 3/7, followed by a pullback to its low in 2022 on 4/1 at 18.57 (orange circle). VIX peaked at 33.63 on 10/11 (red circle) and has trended down following breaking the August up trend (orange line) in late October while equities rose. VIX fell last week, closing at 20.60 (pink circle), below the downtrend (red line) that has been in effect since October 11. Intraday volatility has remained quiet for the past few weeks. However, if VIX closes above 24.00, look for an increase in day-to-day volatility.
Figure 9: Daily New York Stock Exchange (NYSE) New Lows
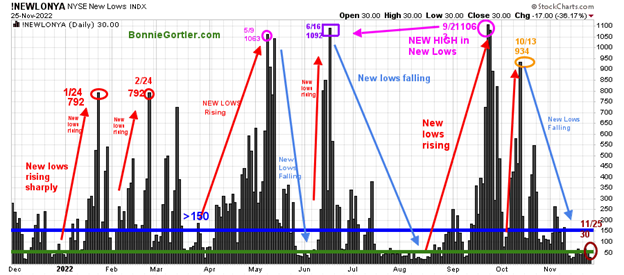
Source: Stockcharts.com
Watching New lows on the New York Stock Exchange is a simple technical tool that helps awareness of the immediate trend's direction. New lows warned of a potential sharp pullback, high volatility, and "panic selling" for most of 2022, closing above 150 in 2022. The peak reading was 9/23 when New Lows made a new high of 1106 (pink circle). New Lows have contracted, trending down since October falling below 150, no longer in a high-risk area. New Lows closed at 30 (brown circle) in a low-risk zone.
Figure 10: New York Stock Exchange Index Weekly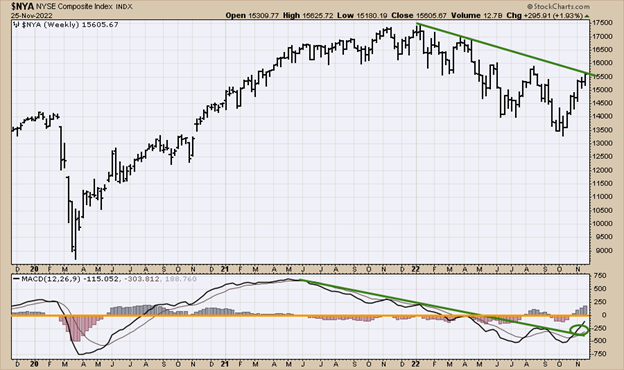
Source: Stockcharts.com
The New York Stock Exchange Index closed at the intermediate downtrend after last week's rise of +1.93%. It’s bullish that the MACD downtrend from June 2021 (green line) is broken, and MACD is rising from below 0 and on a buy. MACD indicates that the New York Index will break the intermediate downtrend to the upside, which could occur as early as next week.
Small Caps lagging the S&P 500 the last two weeks is concerning.
Figure 11: Daily iShares Russell 2000 (IWM) Price (Top) and 12-26-9 MACD (Bottom)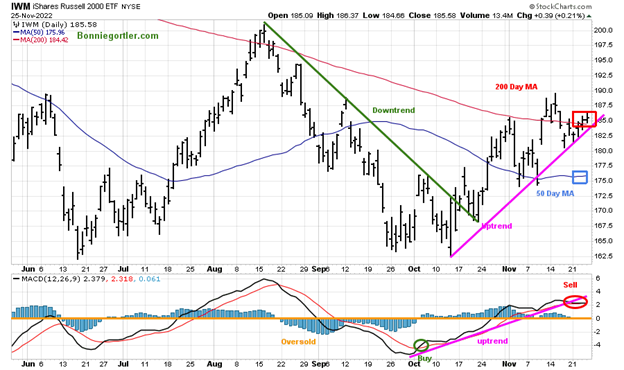
Source: Stockcharts.com
The top portion of the chart is the daily iShares Russell 2000 Index ETF (IWM), the benchmark for small-cap stocks, with a 50-Day Moving Average (MA) (blue line) and 200-Day Moving Average (MA) that traders watch and use to define trends. At the end of March, IWM failed to break out above resistance at 210.00 and then trended lower into June, followed by a rally into August and then turning down until the October low.
IWM closed at 185.58, up +1.01%, and its positive IWM closed above its 50-Day Moving Average (blue rectangle) and 200-Day Moving Average (red rectangle). However, it is a negative sign for IWM to lag the S&P 500 for the second week and for MACD to lose upside momentum. Short-term resistance remains at 190.00, 200.00, followed by 210.00. Support is at 182.50, 175.00, and 170.00.
MACD (middle chart) is on a sell and broke its uptrend; a sign momentum is weakening. A close below 182.50 would imply a short-term decline could occur. However, if IWM can hold above 182.50, expect IWM to rally towards resistance at 190.00.
Figure 12: Daily Invesco QQQ Trust (QQQ) Price (Top) and 12-26-9 MACD (Bottom)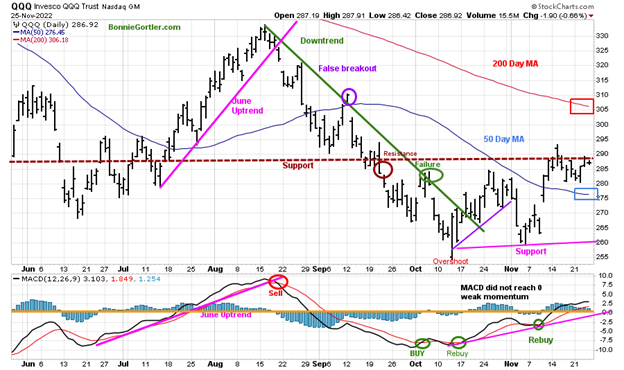
Source: Stockcharts.com
The chart shows the daily Invesco QQQ, an exchange-traded fund based on the Nasdaq 100 Index. QQQ moved lower after a false break out (purple circle) in September of the August downtrend (green line). In November, QQQ broke its October uptrend (purple line), and the decline continued.
QQQ continues to lag the Dow and S&P 500, rising 0.74%, closing at 286.92. QQQ support remains at 278.00 and 275.00. Resistance is 290.00, 300.00, and 310.00. The bottom chart is MACD (12, 26, 9), on a buy above 0, after being below 0 since August, and can, on weakness, is likely to give a sell. QQQ intermediate momentum has turned up.
Figure 13: Weekly Invesco QQQ Trust (QQQ) Price (Top) and 12-26-9 MACD (Bottom)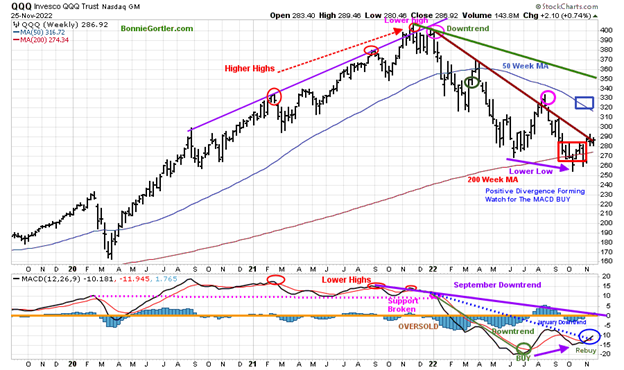
Source: Stockcharts.com
The top chart shows the weekly Invesco QQQ Trust (QQQ). QQQ peaked in November 2021 (red circles) but failed to make a new high in December 2021. QQQ then formed two downtrends (brown line and green line). One downtrend (brown line) was broken back in August, but QQQ immediately turned down (pink circle), making a lower low in October (purple arrow), followed by gains in November.
MACD in the lower chart made a higher low, as QQQ made a lower low, a positive divergence. This week MACD broke the January downtrend (blue dotted line), confirming the start of a potential sustainable rally for the intermediate term (weeks to months). It would be bullish if QQQ has a weekly close above 290.00 and the MACD slope begins to accelerate and ultimately go above 0, breaking the September downtrend (purple line).
Figure 14: VanEck Vectors Semiconductor Weekly and 12-26-9 MACD (Bottom)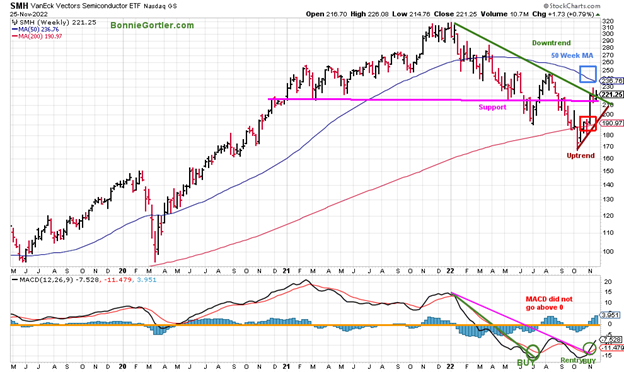
Source: Stockcharts.com
The top part chart shows the Van Eck Vectors Semiconductor (SMH) concentrated, mostly US-based ETF of mega-cap semiconductors companies. SMH is a lead indicator for the market when investors are willing to take on increased risk and the opposite when the market is falling. Semiconductors (SMH), a hot sector recently, closed slightly above its 2022 downtrend (green line), slowing the pace of rise last week but still managed to gain +0.79%. SMH shows signs of underlying strength closing above its 200-Week MA. It would be even better if SMH closes above the 50-Week MA
Support is at 210.00 and 190.00, while resistance remains at 230.00 and 240.00. Its bullish MACD (lower chart) is on a buy, rising, clearly breaking the 2022 downtrend (pink line), showing positive momentum. The short-term remains extended, implying SMH may consolidate. However, the intermediate-term has improved, and for further gains, SMH needs to hold a weekly close above 215.00. On the other hand, a weekly close below 210 would imply a pullback to 190.00.
Figure 15: The S&P 500 Index ($SPX) Daily and 12-26-9 MACD (Bottom)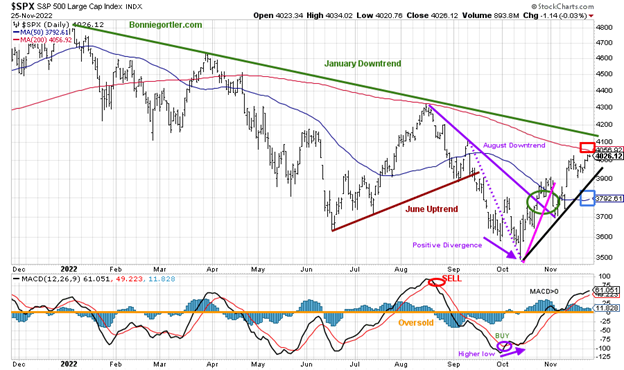
Source: Stockcharts.com
The S&P 500 (SPX) 2022 downtrend remains in effect (green line). After holding above support on the pullback at 3700.00 in early November, SPX has rallied over 400 points. Last week, the S&P 500 (SPX) rose +1.53%, closing at 4026.76, closing above its 50-Day Moving Average (blue rectangle) and close to the 200-Day Moving Average (red rectangle), which it has been unable to penetrate since April. Two closes above would be bullish. Resistance remains at 4100, while support stays at 3900, 3800, and 3700.
MACD, lower chart, remains on a buy, be alert to a MACD sell if the SPX weakens in the near term. On the other hand, if SPX breaks above 4100, a rally toward 4300 is possible. Breakout in the Dow.
Figure 16: The Dow Jones Industrial Average 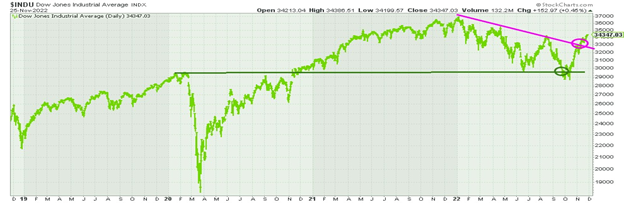
Source: Stockcharts.com
The Dow Jones Industrial Average 2022 downtrend is no longer in effect, a clear breakout. U.S. Dollar weakness continues and is positive for Global and U.S. Equities.
Figure 17: U.S. Dollar Daily 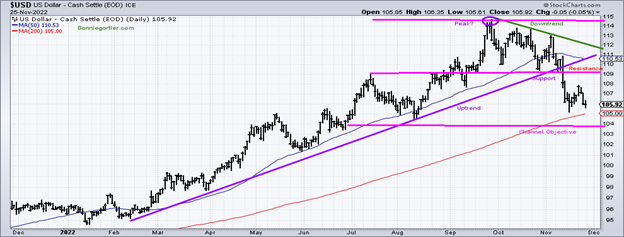
Source: Stockcharts.com
The U.S. dollar peaked in September, starting a downtrend that remains in effect. The U.S. dollar fell -0.85%, closing near its low for the week. The downside objective remains at 103.80. A close above 110.00 would negate the downside objective. The continued weakness of the U.S. dollar falling below support and breaking its uptrend (purple line) bodes well for global and U.S. equities in the coming weeks.
Summing Up:
Small Caps lagged the S&P 500 for the second week, and defensive, not aggressive sectors led the market higher last week is concerning. The short-term momentum indicators are extended with the recent rally and are in a position for a sell if the market turns down from here. On the plus side, intermediate momentum patterns have turned up, showing less downside momentum implying further gains are likely over the next several weeks to months. Keep an eye on market breadth on the NYSE and Nasdaq for an expansion of new highs and contracting New Lows, a clue the rally is broadening and the major averages will move higher. Give the benefit of the doubt to the bulls until proven otherwise. Remember to manage your risk, and your wealth will grow.
If you have any questions or would like to talk about the market email me at Bonnie@Bonniegortler.com.
Disclaimer: Although the information is made with a sincere effort for accuracy, it is not guaranteed that the information provided is a statement of fact. Nor can we guarantee the results of following any of the recommendations made herein. Readers are encouraged to meet with their own advisors to consider the suitability of investments for their own particular situations and for determination of their own risk levels. Past performance does not guarantee any future results.


