

An ‘Inverted Yield Curve’ occurs when short-term US government bonds pay a higher rate of interest than long-term bonds, writes Ian Murphy of MurphyTrading.com.
As of yesterday, a three-month IOU from Uncle Sam was paying 4.37% while a 30-year loan yielded only 3.8%. In the past, this type of inversion was a reliable warning sign that a selloff in stocks and a follow-up recession was imminent. However, this time it might be different (really!!).
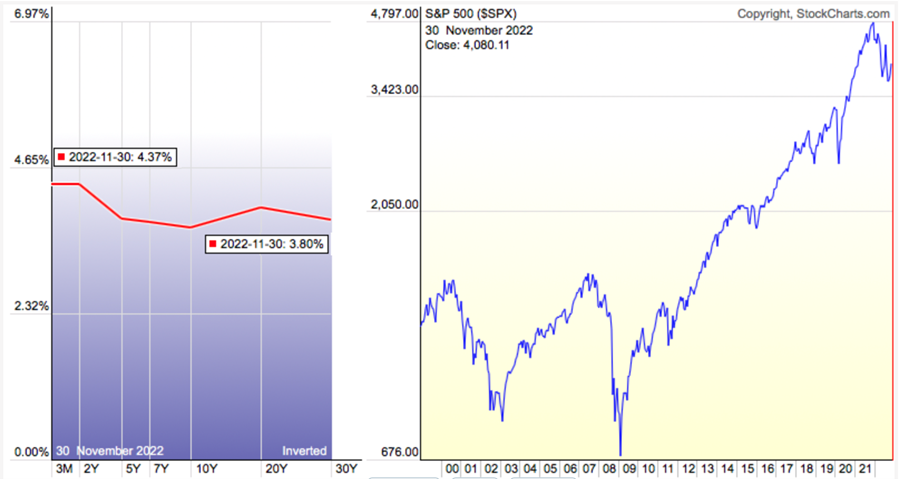
The screengrab above shows the yield on US treasuries across various timeframes on the left and the S&P 500 (SPX) on the right. The inverted curve is obvious, but the S&P 500 has already declined 27.5% in 2022 and by some measures, the recession is already here. In addition, the current interest rate environment is unusual because rates were slashed to historic lows in the wake of the 2008 Financial Crisis and before they had time to edge up, they were shoved down again to deal with the Black Swan event of Covid-19.
Central banks are increasing rates in response to sky-high inflation, but that is a result of supply constraints after Covid lockdowns and the energy price shock from the war in Ukraine, not economic overheating. All the while, employment numbers in the US (due to be updated tomorrow) remain very healthy.
Thankfully I’m not an economist, so I don’t have to explain what’s going on, but regular readers know our long-term strategies have been sitting in cash since the summer. Sure, we have been nibbling at swing trades when they occur, but to return to this market in size for the longer term, we could do worse than following the two strategies outlined below because they have a proven track record for offering signals when it’s time to re-enter.
Tidal Strategy
Once a month this strategy has its day in the sun, and I pulled up the chart about 20 minutes before the close yesterday to see how the monthly candle was shaping up.
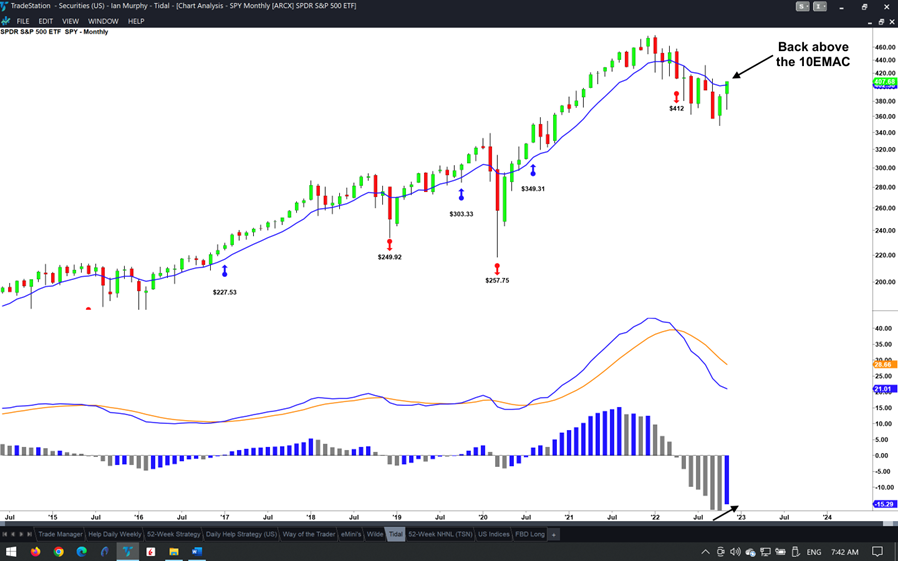
We don’t have a re-entry trigger yet, but the candle has closed above the ten-period Exponential Moving Average for the first time since March, a positive sign. MACD-H is also starting to tick up. So, it’s back to the folder for this one and we will review it again on Friday 30 December.
52-Week Strategy
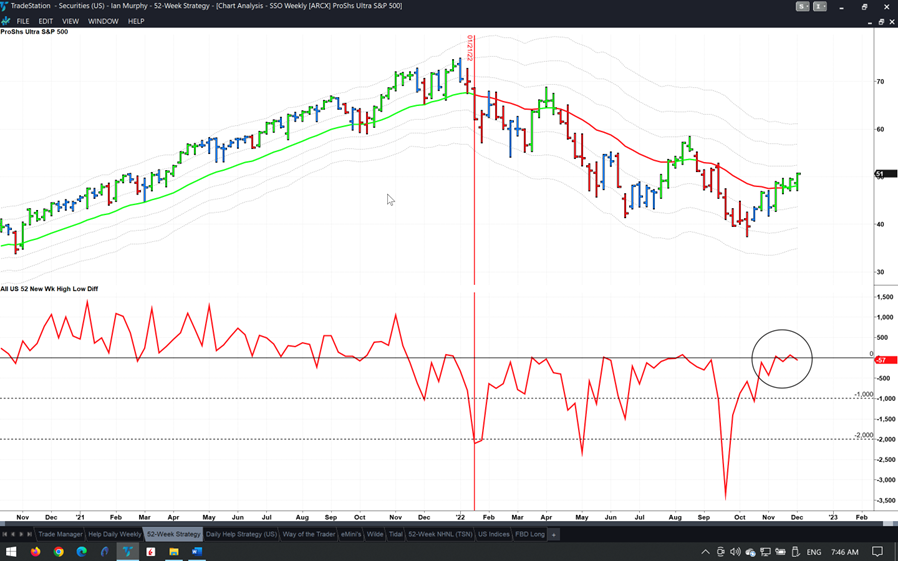
Introduced in last month’s Newsletter, the indicator which offers entry signals on this strategy must close above zero in back-to-back weeks. It has straddled the line for a month but has failed to stay above it. Patience is essential here, and let’s not forget this is a weekly chart so we have two days left in the current price bar and a strong performance might do it.
Wilde Strategy
Throughout November, China experienced unprecedented levels of public protest over ongoing Covid restrictions. The nation has been unable to produce mRNA vaccines domestically and apparently, negotiations with Moderna and Pfizer have stalled due to the refusal of the western firms to hand over their formulas. Something will have to give, and that something might involve China buying vaccines from Moderna, Inc. (MRNA) and Pfizer, Inc. (PFE), so they both go on the Wilde Strategy watchlist.
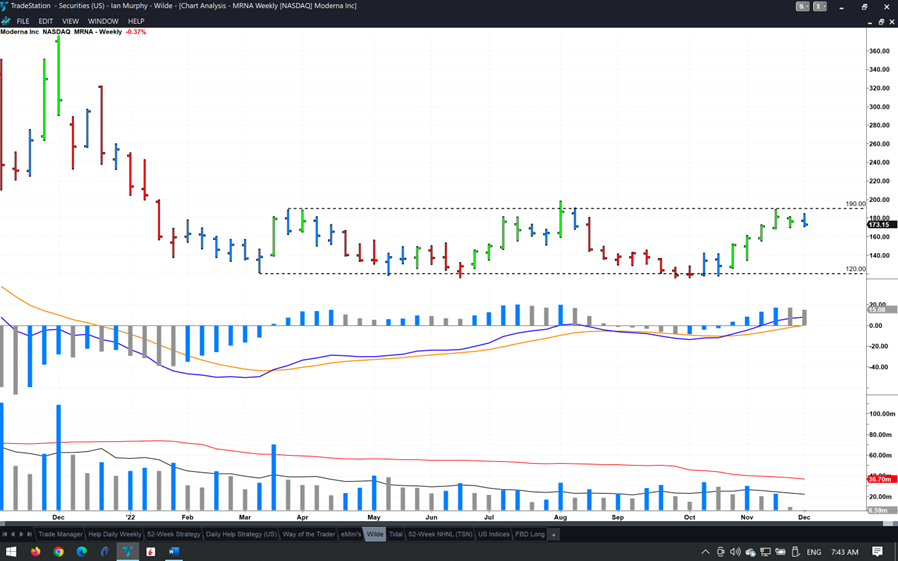
MRNA looks the best, and a gutter has formed with a lower level in the region of $120 and an upper level at $190. I will be looking for a breakout above $190 which holds on a pullback in order to enter. This might be wishful thinking as any announcement of a deal will probably send this stock skywards and the entry might be missed. Let’s wait and see.
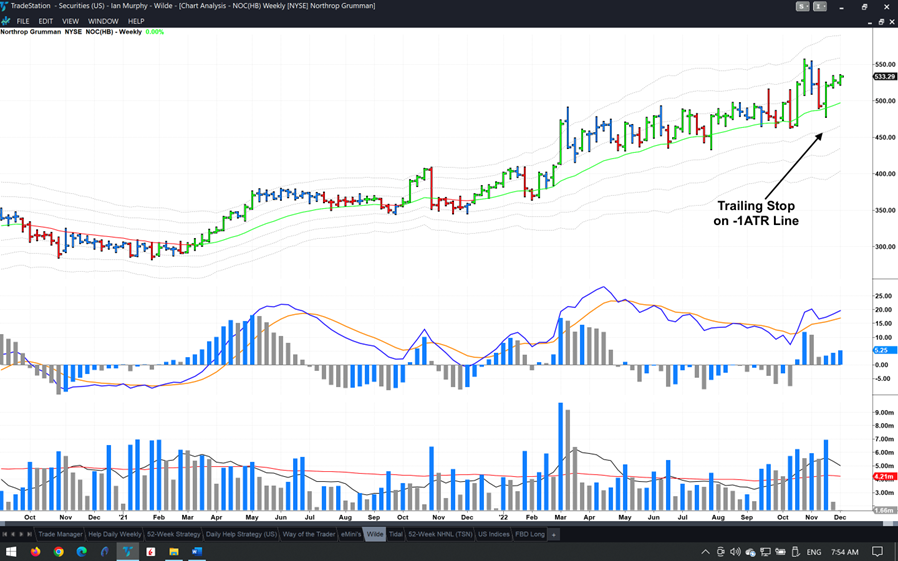
As the war rages in Ukraine and NATO members flood the country with weapons, defense stocks have been soaring. Personally, I don’t trade the sector, but queries have come in and Northrop Grumman (NOC) stands out. The stock has not closed below its -1ATR on a weekly chart in almost two years and the trailing stop is at $465.89 on a weekly closing basis.
Daily Swing Trades
Two short-term daily swing trades were opened recently, and both are performing well. 150 shares were purchased in Broadridge Financial (BR) on November eighth using the FBD Strategy, and 100 have been scaled out at their targets while a stop is being trailed under the remaining 50 shares. At yesterday’s close, the stock was up 9.2% since the entry.
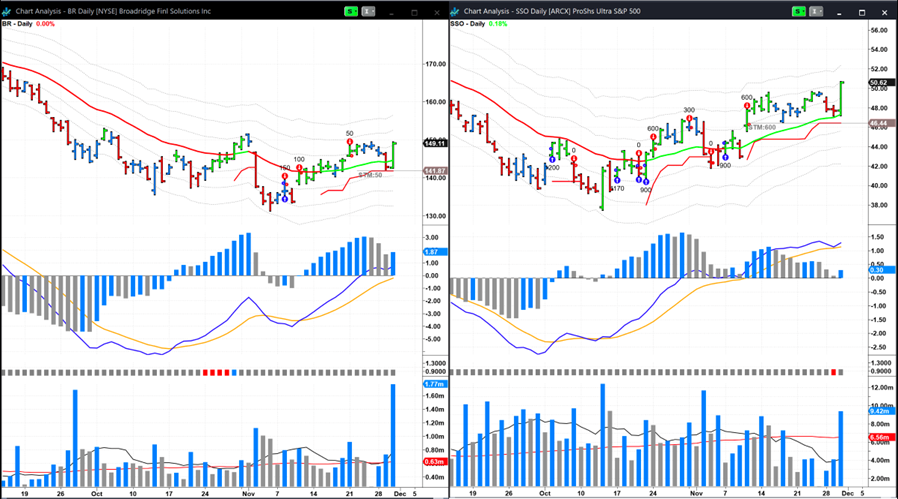
The Help Strategy trade in ProShares Ultra S&P500 2x Shares (SSO) mentioned in the last Newsletter was stopped out for a respectable profit, but a bull trigger offered another entry soon after, and 900 shares were bought. 300 have already been scaled out of this 2x geared ETF and I’ve decided to trail a stop on the remaining 600 shares. The ETF is up 14% since the re-entry trigger thanks in part to yesterday’s 6% gain on foot of Jerome Powell’s dovish comments on future interest rate hikes.
Learn more about Ian Murphy at MurphyTrading.com.


