

We remain in a seasonally bullish period for stocks, states Joe Duarte, editor of In the Money Options.
While the bullish trend could end abruptly once the Fed makes its latest interest rate decision known on December 14, so far, against all odds it seems, the seasonal trends seem to be holding up.
The S&P 500 (SPX) rallied nicely on the heels of what the market took as “dovish” comments from Fed Chair Powell on 11/30/22. There was a pullback over the next couple of days, especially after the jobs report, but most of the late-year rally’s gains, similar to the summer rally’s gains, are holding up.
The wrinkle in the fabric is that most of the gains are resulting from short covering, not real buyers, at least in the major indexes (see below for details). Of course, active traders (guilty) are making the most of the situation. But, somewhere in the shadows is that lingering question: where are the buyers? Moreover, what’s going to happen when there are fewer short sellers who wish to cover their bets?
Interestingly, as I note directly below, even though SPX is rising on short covering, there are some areas of the market where the real money is starting to move in.
Bond Traders Yawn at Employment Number
The bond market had a yawn after the most recent release of US payroll data as the government’s numbers (263,000 new jobs) don’t seem to jibe with the numbers from the private sector.
Prior to the release of the data, bond traders were ecstatic as a myriad of indicators, including global PMI and US ISM data, private payroll numbers (ADP), rising layoff numbers, and climbing jobless claims suggest that the Fed’s rate hikes are starting to bite and that the economy is starting to roll over. After the release, the response was, shall we say muted?
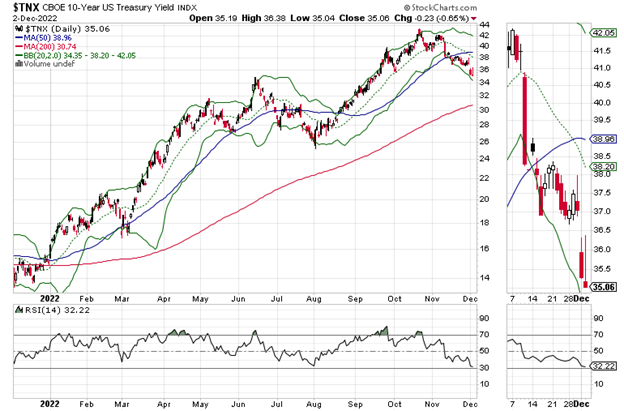
Bond traders are digging into the notion that the US economy is weaker than what the government’s data says. Thus, they’ve sent the US Ten-Year Note yield (TNX) to the 3.5% area, shaving nearly 0.75 basis points from the key benchmark in about two months—a rare and heady move.
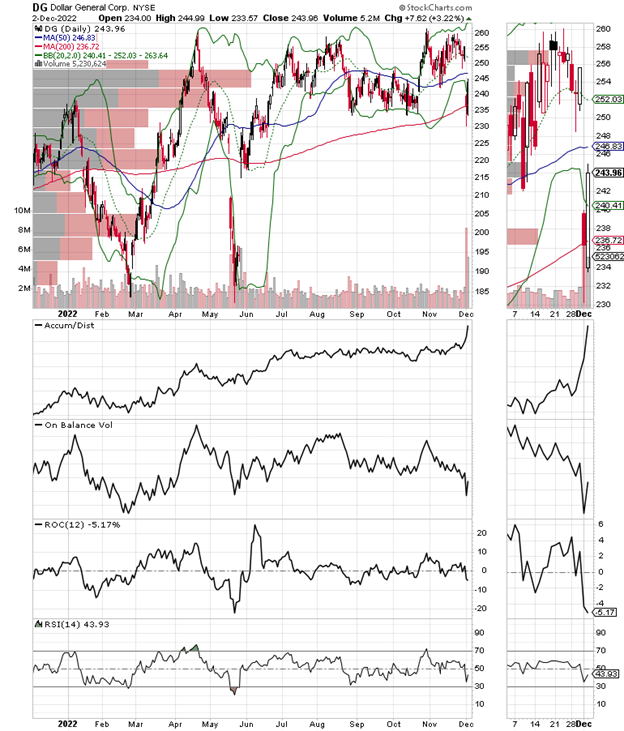
Perhaps, the clearest expression of what may lie ahead is seen in shares of discount retailer Dollar General (DG), whose shares cratered prior to the employment report as the private sector data was making its way through the markets. Certainly, shares bounced back after payroll numbers, but they remained well below recent levels.
The message here is clear. Until proven otherwise bonds are still betting on a recession, which isn’t going to bode well for lower-income consumers who are already suffering from the post-Covid supply chain issues, inflation, and now the Fed’s rate hikes.
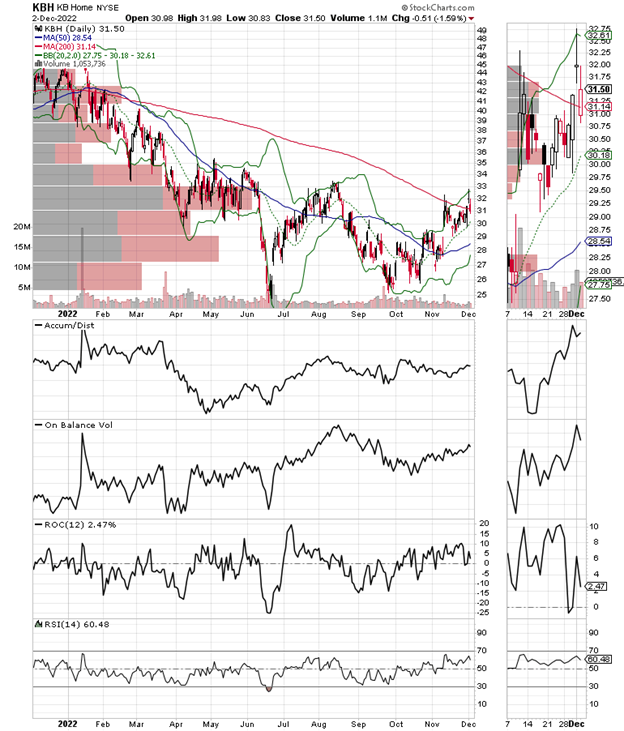
Meanwhile, behind reports that the recent drop in mortgage rates that has resulted from the decline in TNX has increased interest in mortgages for home buyers, the homebuilder stocks continue to attract money. This is true of even middle-of-the-pack builders like KB Homes (KBH), which recently broke above its 200-day moving average.
Again, prior to the payroll numbers, KBH was building a head of steam.
The spectacular jump in Accumulation Distribution (Adi) is a clear sign that short sellers are now panicking as they realize that pent-up demand for homes could well spruce up results for homebuilders over the next couple of quarters. Meanwhile, On Balance Volume (OBV) is perking up as real buyers move in.
If KBH can move decisively above $33, we could see a 10-20% move higher in the next few weeks, barring something nasty derailing the mood.
So, as I said in my most recent post “if the bond market is correct, which is more than plausible, and the Fed is wrong, which is a historically accurate expectation, the central bank will go too far in its rate hikes.” The prevailing bet in the bond market is that the economy is slowing rapidly. For stock traders, the other side of the bet is that the sudden slowing will likely prompt the Fed to resort to QE once again.
NYAD Shrugs Off Jobs Number. Liquidity Improves
The New York Stock Exchange Advance Decline line (NYAD) made a new high on 12/2/22 while the market’s liquidity showed signs of improvement. Both signs suggest for now seasonality is more influential than the fear of the Fed.
Meanwhile, the CBOE Volatility Index (VIX) is collapsing, adding to the bullish tone. When VIX rises stocks tend to fall as rising put volume is a sign that market makers are selling stock index futures in order to hedge their put sales to the public. A fall in VIX is bullish as it means less put option buying.
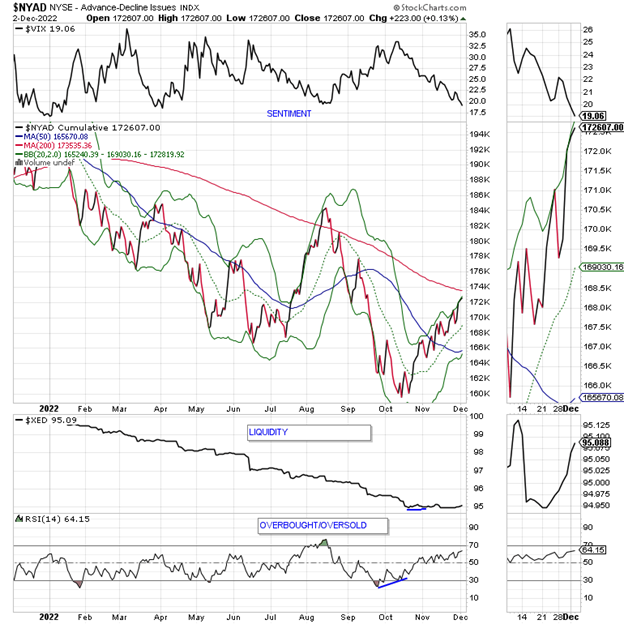
The Eurodollar Index may have bottomed out in the short term. That is usually a sign that liquidity is improving.
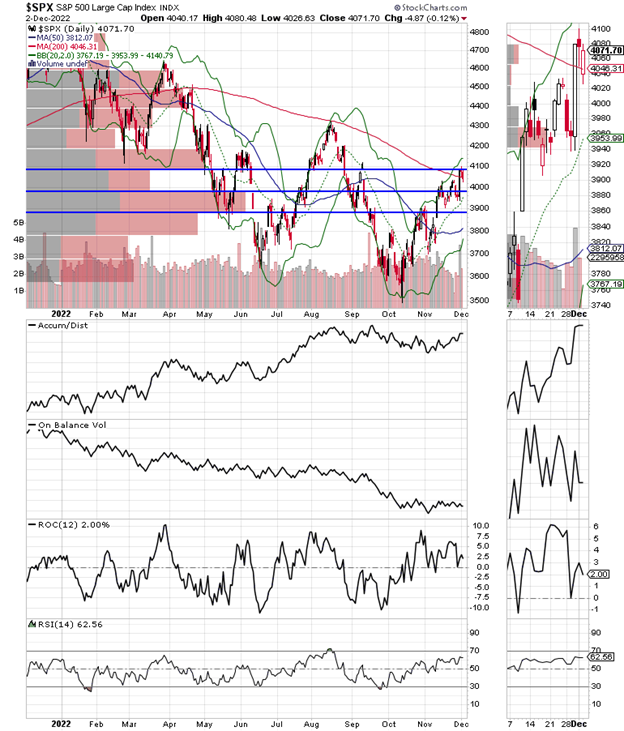
The S&P 500 closed just below the 4100 resistance level but above its 200-day moving average. Accumulation Distribution (ADI) improves as more short sellers cover. On Balance Volume (OBV) is still not indicative of heavy real buying.
Critical support now lies at 3800-3900.
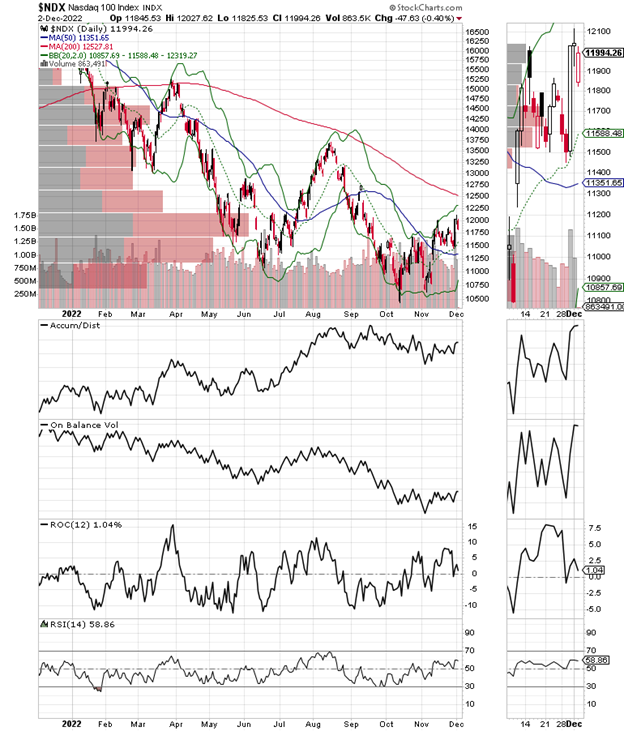
The Nasdaq 100 Index (NDX) is still stuck between the 11,000-12,000 trading range. ADI and OBV are similar to SPX.
To learn more about Joe Duarte, please visit JoeDuarteintheMoneyOptions.com.


