
For today’s Trade of the Day we will be looking at an On Balance Volume chart for Amazon.com, Inc. (AMZN), states Chuck Hughes of TradeWinsDaily.
Before breaking down AMZN’s OBV chart let’s first review which products and services are offered by the company.
Amazon.com, Inc. engages in the retail sale of consumer products and subscriptions in North America and internationally. The company operates through three segments: North America, International, and Amazon Web Services (AWS). It sells merchandise and content purchased for resale from third-party sellers through physical and online stores. The company also manufactures and sells electronic devices, including Kindle, Fire tablets, Fire TVs, Rings, Echo, and other devices.
Confirming a Price Downtrend with OBV
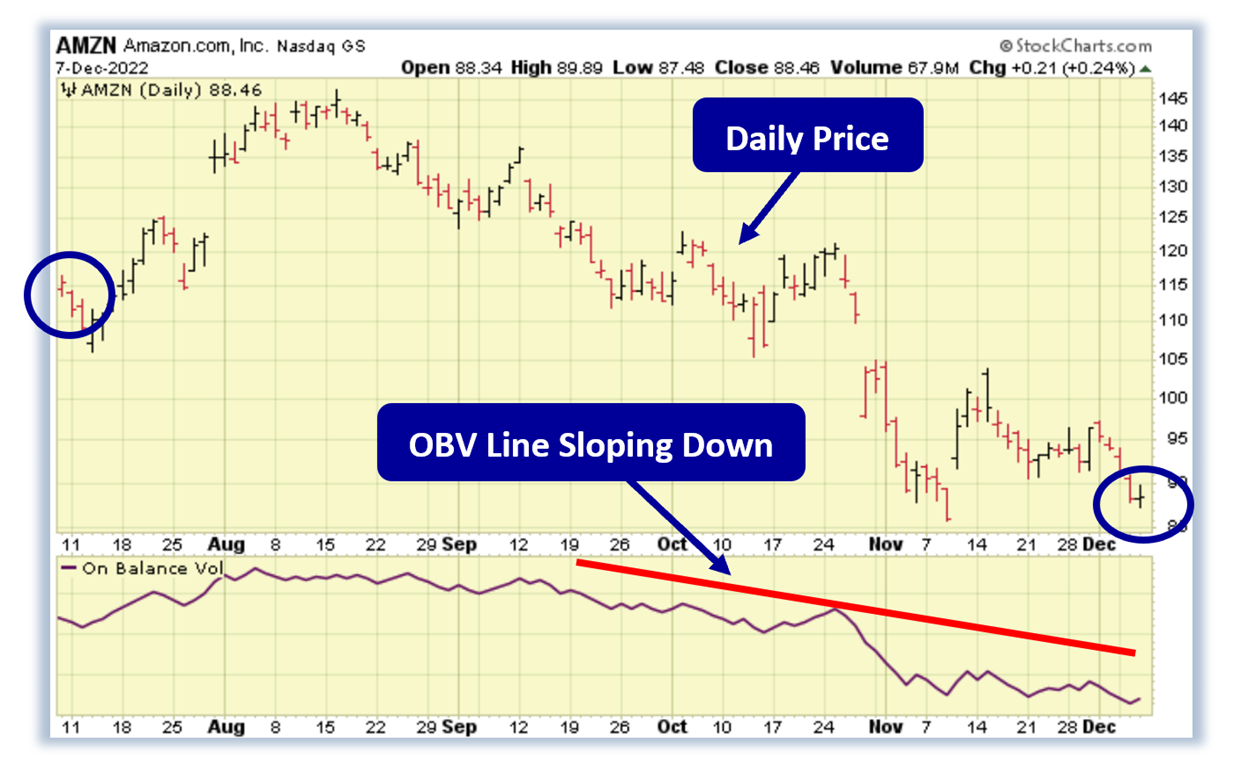
The AMZN daily price chart below shows that AMZN is in a price downtrend as the current price is below the price AMZN traded at five months ago (circled). The On Balance Volume chart is below the daily chart.
On Balance Volume measures volume flow with a single Easy-to-Read Line. Volume flow precedes price movement and helps sustain the price downtrend. When a stock closes up, volume is added to the line. When a stock closes down, volume is subtracted from the line. A cumulative total of these additions and subtractions form the OBV line.
On Balance Volume Indicator
- When Close is Up, Volume is Added
- When Close is Down, Volume is Subtracted
- A Cumulative Total of Additions and Subtractions form the OBV Line
Volume flow precedes price and is the key to measuring the validity and sustainability of a price trend.
We can see from the OBV chart below that the On Balance Volume line for AMZN is sloping down. A down-sloping line indicates that the volume is heavier on down days and selling pressure is exceeding buying pressure. Selling pressure must continue to exceed buying pressure in order to sustain a price downtrend. So, On Balance Volume is a simple indicator to use that confirms the price downtrend and its sustainability.
The numerical value of the On Balance Volume line is not important. We simply want to see a down-sloping line to confirm a price downtrend.
Confirmed ‘Sell’ Signal for AMZN
Since AMZN's OBV line is sloping down, the most likely future price movement for AMZN is down, making AMZN a good candidate for a put option debit spread.
Let's use the Hughes Optioneering calculator to look at the potential returns for an AMZN debit spread.
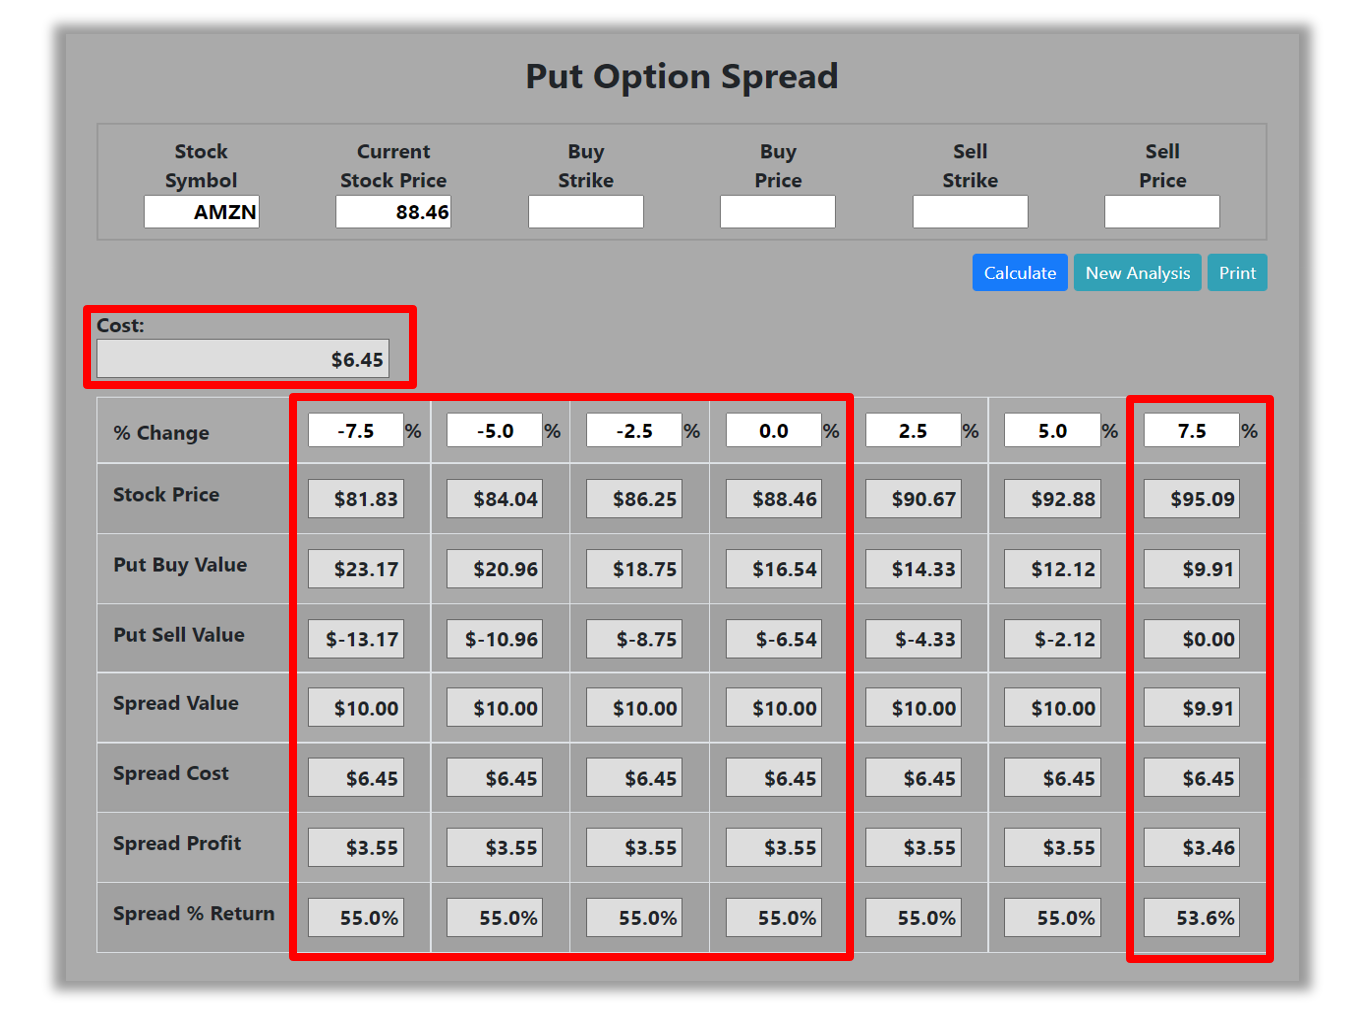
The Put Option Spread Calculator will calculate the profit/loss potential for a put option spread based on the price change of the underlying stock/ETF at option expiration in this example from a 7.5% decrease to a 7.5% increase in AMZN stock at option expiration.
The goal of this example is to demonstrate the ‘built-in’ profit potential for option spreads and the ability of spreads to profit if the underlying stock is down, up, or flat at option expiration. Out of fairness to our paid option service subscribers, we don’t list the option strike prices used in the profit/loss calculation.
The prices and returns represented below were calculated based on the current stock and option pricing for AMZN on 12/7/2022 before commissions.
Built-in Profit Potential
For this option spread, the calculator analysis below reveals the cost of the spread is $645 (circled). The maximum risk for an option spread is the cost of the spread. The analysis reveals that if AMZN stock is flat or down at all at expiration the spread will realize a 55.0% return (circled). And if AMZN stock increases 7.5% at option expiration, the option spread would make a 53.6% return (circled).
Due to option pricing characteristics, this option spread has a ‘built-in’ 55.0% profit potential when the trade was identified. Option spread trades can result in a higher percentage of winning trades compared to a directional option trade if you can profit when the underlying stock/ETF is up, down, or flat. A higher percentage of winning trades can give you the discipline needed to become a successful trader.