
For today’s trade of the day e-letter we will be looking at a daily price chart for ServiceNow, Inc. (NOW), states Chuck Hughes of TradeWinsDaily.
Before breaking down NOW’s daily chart let’s first review what products and services the company offers.
ServiceNow, Inc. provides enterprise cloud-computing solutions that defines, structures, consolidates, manages, and automates services for enterprises worldwide. It operates the Now platform for workflow automation, artificial intelligence, machine learning, robotic process automation, performance analytics, electronic service catalogs and portals, configuration management systems, data benchmarking, encryption, and collaboration and development tools.
Now, let’s begin to break down the Daily Price chart for NOW stock. Below is a Daily Price chart with the 50-day EMA and 100-day EMA for NOW.
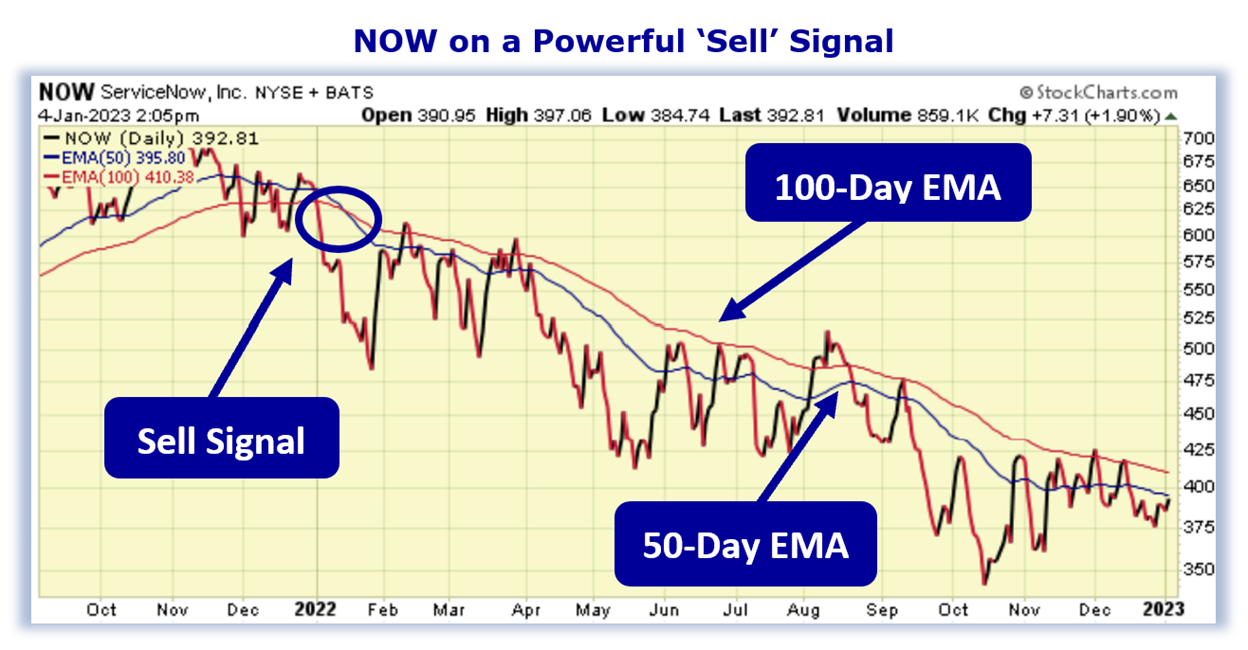
50-Day EMA and 100-Day EMA ‘Sell’ Signal
The 50-day exponential moving average (EMA) and 100-day EMA are moving average indicator lines that can provide buy and sell signals when used together. When the shorter-term 50-day EMA crosses above or below the longer-term 100-day EMA, this provides either a buy or sell signal depending on which direction the stock price is moving.
- 50-Day EMA line Above 100-Day EMA = Price Uptrend = Buy signal
- 50 Day EMA line Below 100-Day EMA = Price Downtrend = Sell signal
When the 50-day EMA (blue line) crosses above the 100-day EMA (red line) this indicates that the stock’s buying pressure has begun to outweigh the selling pressure signaling a ‘buy’ signal. When the 50-day EMA crosses below the 100-day EMA this indicates that the selling pressure has begun to outweigh the buying pressure signaling a ‘sell’ signal.
Sell NOW Stock
As the chart shows, on January 13, 2022, the NOW 50-day EMA, crossed below the 100-day EMA. This crossover indicated the selling pressure for NOW stock exceeded the buying pressure. For this kind of crossover to occur, a stock has to be in a strong bearish trend.
Now, as you can see, the 50-day EMA is still below the 100-day EMA meaning the ‘sell’ signal is still in play. As long as the 50-day EMA remains below the 100-day EMA, the stock is more likely to keep trading at new lows and bearish positions should be initiated. Our initial price target for NOW stock is 375.00 per share.
Profit if NOW is Down, Up, or Flat
Now, since NOW’s 50-day EMA is trading below the 100-day EMA, the stock will likely continue its trend downward. Let’s use the Hughes Optioneering calculator to look at the potential returns for a NOW put option spread.
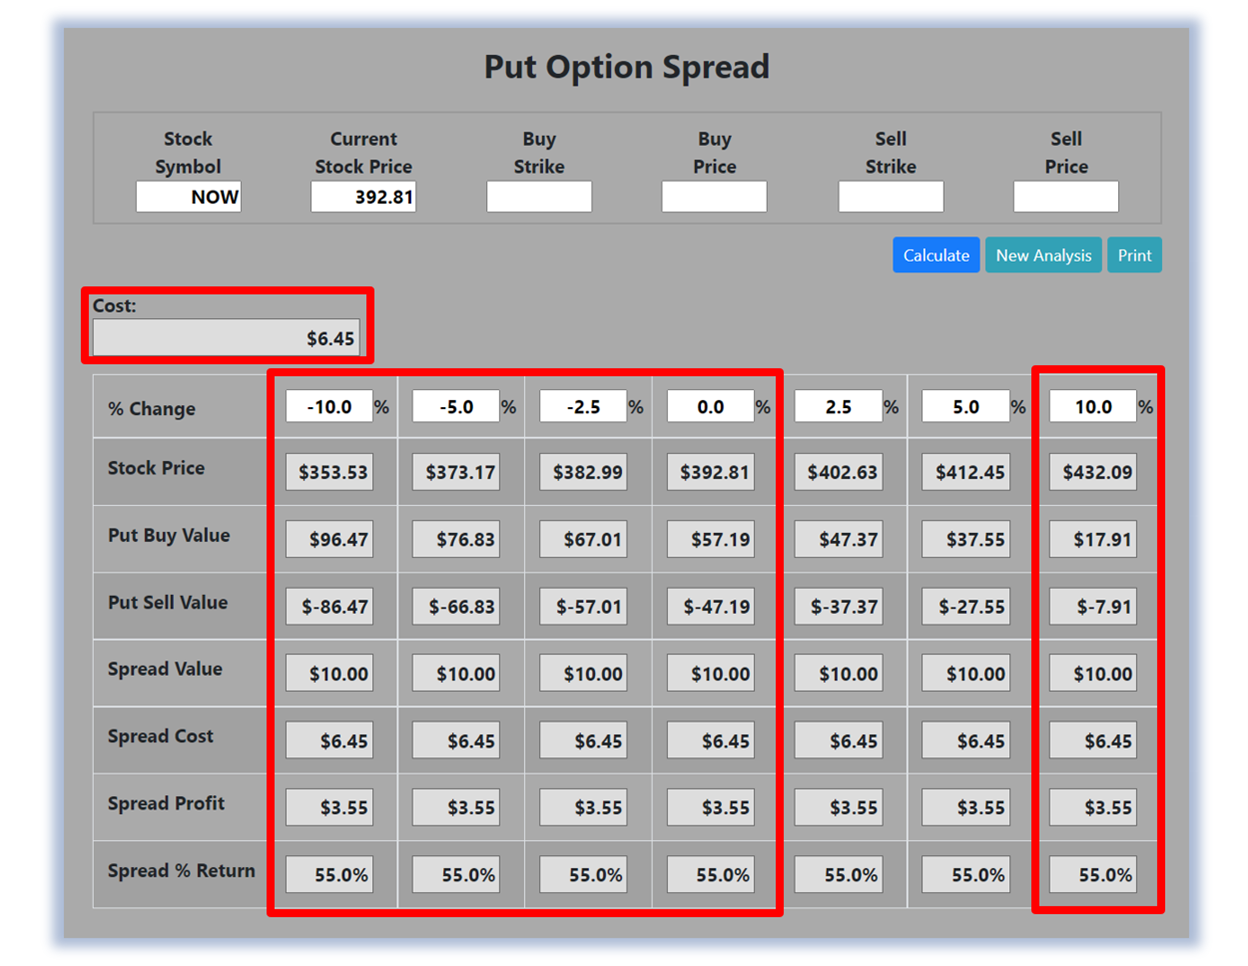
The Put Option Spread Calculator will calculate the profit/loss potential for a put option spread based on the price change of the underlying stock/ETF at option expiration in this example from a 10.0% decrease to a 10.0% increase in NOW stock at option expiration.
The goal of this example is to demonstrate the ‘built in’ profit potential for option spreads and the ability of spreads to profit if the underlying stock is down, up, or flat at option expiration. Out of fairness to our paid option service subscribers we don’t list the option strike prices used in the profit/loss calculation.
The prices and returns represented below were calculated based on the current stock and option pricing for NOW on 1/4/2023 before commissions.
Built-in Profit Potential
For this option spread, the calculator analysis below reveals the cost of the spread is $645 (circled). The maximum risk for an option spread is the cost of the spread. The analysis reveals that if NOW stock is flat or down at all at expiration the spread will realize a 55.0% return (circled). And if NOW stock increases 10.0% at option expiration, the option spread would make a 55.0% return (circled).
Due to option-pricing characteristics, this option spread has a ‘built in’ 55.0% profit potential when the trade was identified. Option spread trades can result in a higher percentage of winning trades compared to a directional option trade if you can profit when the underlying stock/ETF is up, down or flat. A higher percentage of winning trades can give you the discipline needed to become a successful trader.
The Hughes Optioneering Team is here to help you identify profit opportunities just like this one.