
For today’s trade of the day, we will be looking at a Daily Price chart for Starbucks Corp. (SBUX), states Chuck Hughes of TradeWinsDaily.
Before breaking down SBUX’s daily price chart let’s first review which products and services are offered by the company. Starbucks Corporation, together with its subsidiaries, operates as a roaster, marketer, and retailer of specialty coffee worldwide. The company operates through three segments: North America, International, and Channel Development. Its stores offer coffee and tea beverages, roasted whole beans and ground coffees, single-serve products, and ready-to-drink beverages; and various food products, such as pastries, breakfast sandwiches, and lunch items.
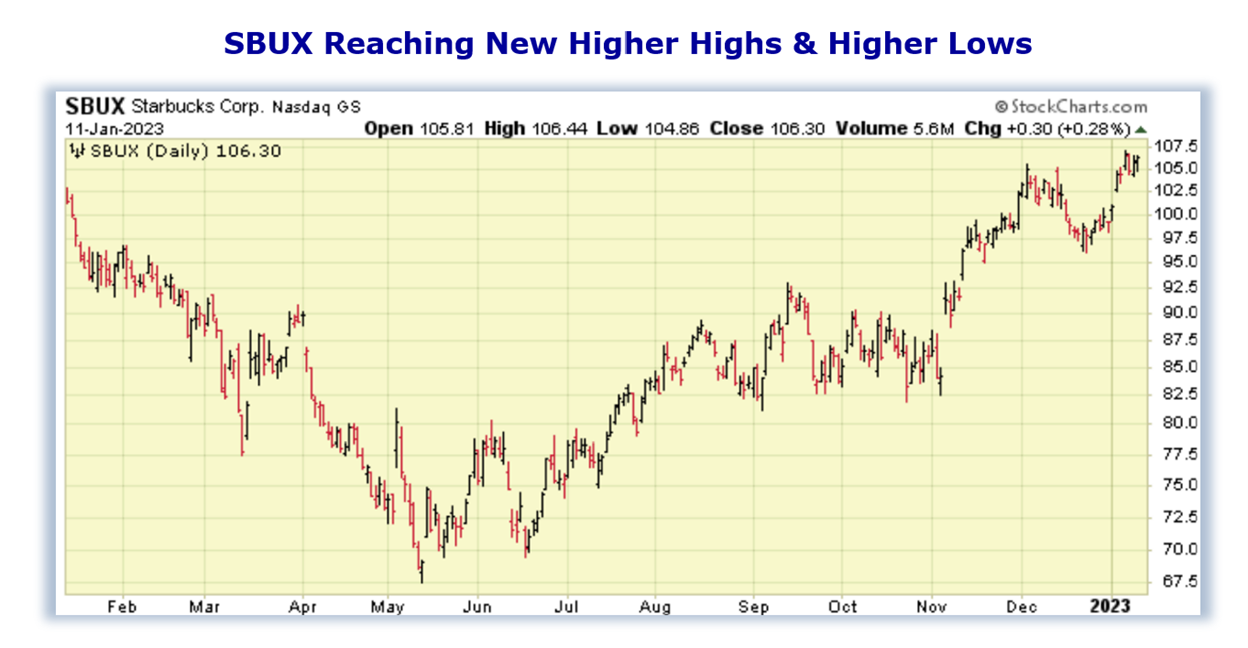
Now, let’s begin to break down the Daily Price chart for SBUX. Below is a Daily Price Chart with the price line displayed by an OHLC bar.
Buy SBUX Stock
The Daily Price chart above shows that SBUX stock began reaching a series of higher highs and higher lows in early January. This pattern of bullish trading suggests the stock will march on to a further advance. See, after a stock makes a series of two or higher highs and higher lows, the stock typically continues its price-up trend and should be purchased. Our initial price target for SBUX stock is 112.00 per share.
Profit if SBUX is Up, Down or Flat
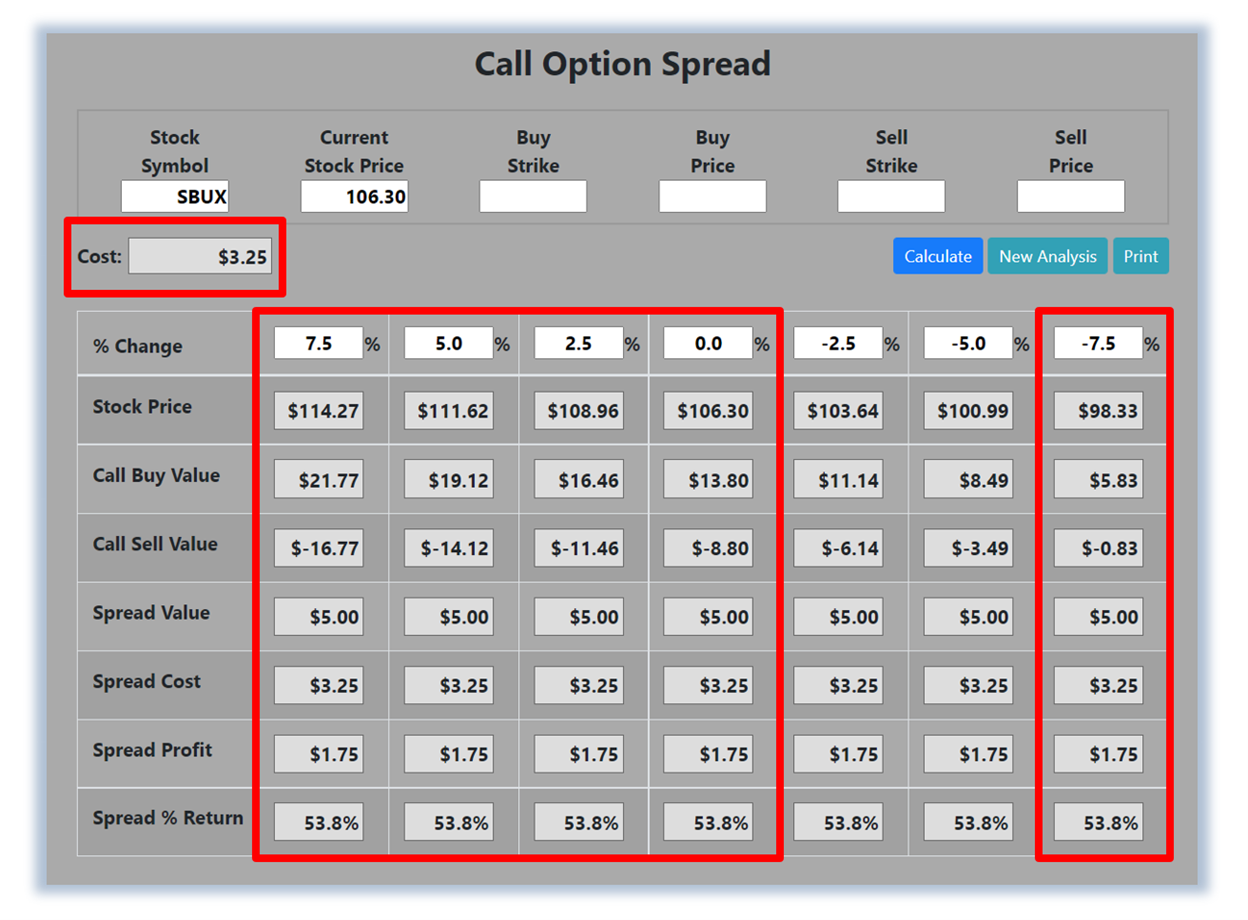
Now, since SBUX stock is currently making a series of higher highs and higher lows and will likely rally from here, let’s use the Hughes Optioneering calculator to look at the potential returns for an SBUX call option spread. The Call Option Spread Calculator will calculate the profit/loss potential for a call option spread based on the price change of the underlying stock/ETF at option expiration in this example from a 7.5% increase to a 7.5% decrease in SBUX stock at option expiration.
The goal of this example is to demonstrate the ‘built-in’ profit potential for option spreads and the ability of spreads to profit if the underlying stock is up, down, or flat at option expiration. Out of fairness to our paid option service subscribers we don’t list the option strike prices used in the profit/loss calculation. The prices and returns represented below were calculated based on the current stock and option pricing for SBUX on 1/11/2023 before commissions.
Built-in Profit Potential
For this option spread, the calculator analysis below reveals the cost of the spread is $325 (circled). The maximum risk for an option spread is the cost of the spread. The analysis reveals that if SBUX stock is flat or up at all at expiration the spread will realize a 53.8% return (circled). And if SBUX stock decreases 7.5% at option expiration, the option spread would make a 53.8% return (circled).
Due to option pricing characteristics, this option spread has a ‘built-in’ 53.8% profit potential when the trade was identified. Option spread trades can result in a higher percentage of winning trades compared to a directional option trade if you can profit when the underlying stock/ETF is up, down, or flat. A higher percentage of winning trades can give you the discipline needed to become a successful trader.