

When the market was bottoming on October 13 of 2022 at 3500SPX, the members of ElliottWaveTrader knew to begin looking up to the 4100SPX region for an initial rally off those lows, explains Avi Gilburt of ElliotWaveTrader.net.
The day before the market bottomed (October 12), I sent out an update to our members noting the following:
“Thus far, the market has made several attempts at hitting the blue box support region on the 60-minute SPX chart. And, each time, divergences continue to grow. And, if you look at the five-minute SPX chart, there is still an opportunity to strike that support below as long as we remain below the smaller degree resistance noted....But, I think we will likely be much higher than where we stand today as we look out towards the end of October, or even into early November, depending on how long it takes the market to bottom out, and how fast the rally I expect takes hold.”
And, this was the attached chart:
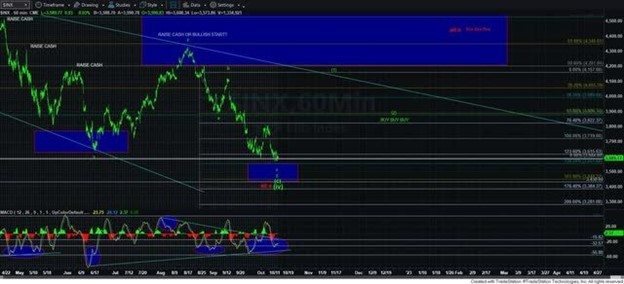
Elliottwavetrader.net
Then, in the pre-market hours after the CPI report came out, I posted an update to our members at 8:56 am, noting my expectations for a bottom being struck and noting that “[t]his should now be the selling climax that completes the downside structure.” The market bottomed within half an hour of my alert, and we began the rally that I told them to expect the prior day.
At the time, I expected that the market was going to rally to the 4100SPX region, followed by a pullback. From that pullback, I expected that the market would continue to rally to the 4300SPX region, with the potential we can rally as high as the 4400/4500SPX region, depending upon the structure the market develops during that rally.
Yet, once the CPI report was announced on October 13, it seems most others were caught by surprise by the rally. This was a comment I saw in an article on Seeking Alpha that morning which typified most feelings at the time:
“Am I the only one wondering what the heck is going on with this market? I feel like it makes no sense anymore. Today made no sense.”
In a Barron’s article later that day, the author outlined the common feeling in the market:
“It was a massive rally and one that came out of nowhere. And it’s left market observers like yours truly wondering what the heck just happened. There wasn’t any new data, no headline-making speeches, and no event that occurred just after the opening to spur such a move. It came out of nowhere—and left us grasping for possible reasons. “Today’s market reversal was a head-scratcher,” writes Oanda’s Edward Moya. And he’s not wrong.”
And, just yesterday, I saw these two comments on Seeking Alpha:
“Last week's action was silly.”
“I didn’t anticipate this rally, it has no basis in reality.”
I see all too often both analysts and commenters claim that the market is wrong. If someone claims that the market is wrong, I strongly urge you to “cancel” that person as they are not dealing with actual reality. You see, price is the truth. If your market “logic” does not comport with the price action, then your logic is crooked, and you are not dealing with reality.
So, I guess we have to question the definition of “reality,” as our members were quite prepared for the rally off the October 13 low:
“...today was like EW proof on steroids. Had an up 8% portfolio run—including selling shorts at the bottom and immediately loading up on the turn. Without this service, I would never have been poised to jump that quickly. The confidence of recent updates was pretty overwhelming.”
“Just want to say that was an amazing call this morning. I have been a member for about eight months. An Elliott wave neophyte, but lots of trading experience. Just amazed. I am 62, old dawg. Great, great service.”
Yet, the common market confusion did not stop there. The market then topped in the 4100SPX region on a much better-than-expected CPI report, just as everyone was sure that it was going to project the market higher. And this has continued to happen over the last 5 months, as the market has moved in the exact opposite direction of common expectations after most of the reports have been published. If you are being honest about it, then you would know exactly what I am speaking of. And this is what one of our members noted about this action:
“I mean, bottoming on the worst inflation print and topping on the best... takes a lot of mental gymnastics to make that square without EWT”
This past week, when the market dropped on Thursday and Friday, it had many scratching their heads again, especially after the Fed noted that it was not being as aggressive in its rate hiking. Everyone seemed to again be surprised by the market pullback after such great news about the economy presented in the jobs report, as noted by another typical comment we saw on Friday:
“When you have reports like yesterday's jobs number, how can you not be confused.”
But, again, the members of ElliottWaveTrader were not fooled. I was outlining to our members the importance of the 4195SPX level several times on Thursday, from which I expected a nice pullback.
Now, take note as to where we topped on Thursday—4195.44. And, then we dropped down to the target I outlined to our members on Friday. But they did not see anything about any economic reports in my analysis. They did not see anything about the economy in my analysis. And they did not see anything about the Fed in my analysis. As another of our members noted about our application of mathematics to market movements as our primary analysis perspective:
“Avi is so nonchalant about all this. Meanwhile, we are navigating the future while most all other market participants are whistling in the dark looking backward.”
So, of course, this brings me to the key point of what is most important to know in the coming week. That is the 4105SPX region. As long as the market remains over that support region, then I am looking higher to the 4216-4250SPX region before we see another pullback.
However, please note that if the market should break the 4105SPX support region early in the coming week in a sustained fashion, then it will open the door to drop back down to the 4000SPX region before another rally may take shape.
Again, take note that I am not pointing to economic reports, earnings, or anything else for that matter. While I view those items as catalysts for a move, the substance of those items is not always indicative of the direction of the next market movement. And, we have all experienced that over the last 4-5 months. So, I am going to beg you to not ignore what happened during these last 4-5 months. Please take it as a learning opportunity rather than simply brushing it off and moving on to the next report or announcement you expect will move the market.
I know I post this quite often, but I do so because I think it teaches one of the hardest lessons to learn about the stock market. Yet, most simply refuse to learn this lesson. In his book, The Socionomic Theory of Finance (a book I strongly recommend to every investor), Robert Prechter noted:
"Observers' job, as they see it, is simply to identify which external events caused whatever price changes occur. When the news seems to coincide sensibly with market movement, they presume a causal relationship. When news doesn't fit, they attempt to devise a cause-and-effect structure to make it fit. When they cannot even devise a plausible way to twist the news into justifying market action, they chalk up the market moves to "psychology," which means that, despite a plethora of news and numerous inventive ways to interpret it, their imaginations aren't prodigious enough to concoct a credible causal story.
Most of the time it is easy for observers to believe in news causality. Financial markets fluctuate constantly, and news comes out constantly, and sometimes the two elements coincide well enough to reinforce commentators' mental bias toward mechanical cause and effect. When news and the market fail to coincide, they shrug and disregard the inconsistency. Those operating under the mechanics paradigm in finance never seem to see or care that these glaring anomalies exist."
Folks, we have experienced exceptionally glaring anomalies over the last five months. Take off your blinders and open your eyes and mind to them. Try to understand why the market moves opposite of common expectations rather than simply dismissing it. Is there something out there that can provide you with better guidance? Well, the answer is yes, but it does take some time and effort to learn.
And, while I do understand that this is a forum for fundamental analysis, I would strongly urge you to open your mind to what I am trying to present. As one of my members just wrote the other day:
“I am fundamentals meet technicals kind of guy....but when it comes to markets that Avi & team analyze...I have not seen anyone come close in my 25 years of observation. Avi for me is a financial Myth buster.”
So, in the coming week, we can keep this simple. 4105SPX is our support, which if held, points us to 4216-4250SPX. However, if it breaks, it opens the door to another drop-down to the 4000SPX region. That is all I need to know for the coming week based on the current structure of the market.
And, no, this is not the same as saying the market will either go up or down as so many foolish commenters post. Rather, this gives you very specific parameters to track to have a better understanding of the potential coming movements in the market. I know of no one else on Seeking Alpha that provides such specificity, and it is because they do not have the tools to do so.
Remember, the financial market is a non-linear environment, and the appropriate manner in which to approach and navigate it is with a non-linear methodology. And, as I have said many times before, this is no different than if an army general were to draw up his primary battle plans, and, at the same time, also draw up a contingency plan if his initial battle plans do not work in his favor. It is simply how the general prepares for battle. We prepare for market battles in the same manner.
Most analysts take a position on the market based upon a fundamental theory and simply retain that perspective despite the market moving against that position by 10%+. Just look at those that have been bearish during this 700-point (20%) rally off the October lows. Yet, they continue to present their bearish views with the same mantra presented over and over. Moreover, they have no objective way of knowing they are wrong until large losses mount.
“Avi, I'm just so glad (and lucky) to have found your service last year. I can tell you that so many other analysts I follow, including some in discord, were massively shorting this rally and calling for new lows in March. Their members are all now crying in discord about how much money they have lost. I do genuinely feel bad for them, but just thank God I have been following your advice since October about that rally to 4300+”
Also, this update was written on Sunday but does not get published until Monday. So, if we have broken below 4105SPX by the time it gets published, then you know what I think.
Avi Gilburt is a widely followed Elliott Wave analyst and founder of ElliottWaveTrader.net, a live trading room featuring his analysis on the S&P 500, precious metals, oil, and USD, plus a team of analysts covering a range of other markets.


