
For today’s trade of the day we will be looking at an On Balance Volume chart for Texas Roadhouse, Inc. (TXRH), states Chuck Hughes of Hughes Optioneering.
Before breaking down TXRH’s OBV chart let’s first review which products and services are offered by the company. Texas Roadhouse, Inc., together with its subsidiaries, operates casual dining restaurants in the United States and internationally. The company operates and franchises restaurants under the Texas Roadhouse, Bubba's 33, and Jaggers names. As of December 28, 2021, it operated 566 domestic restaurants and 101 franchise restaurants.
Confirming a Price Uptrend with OBV
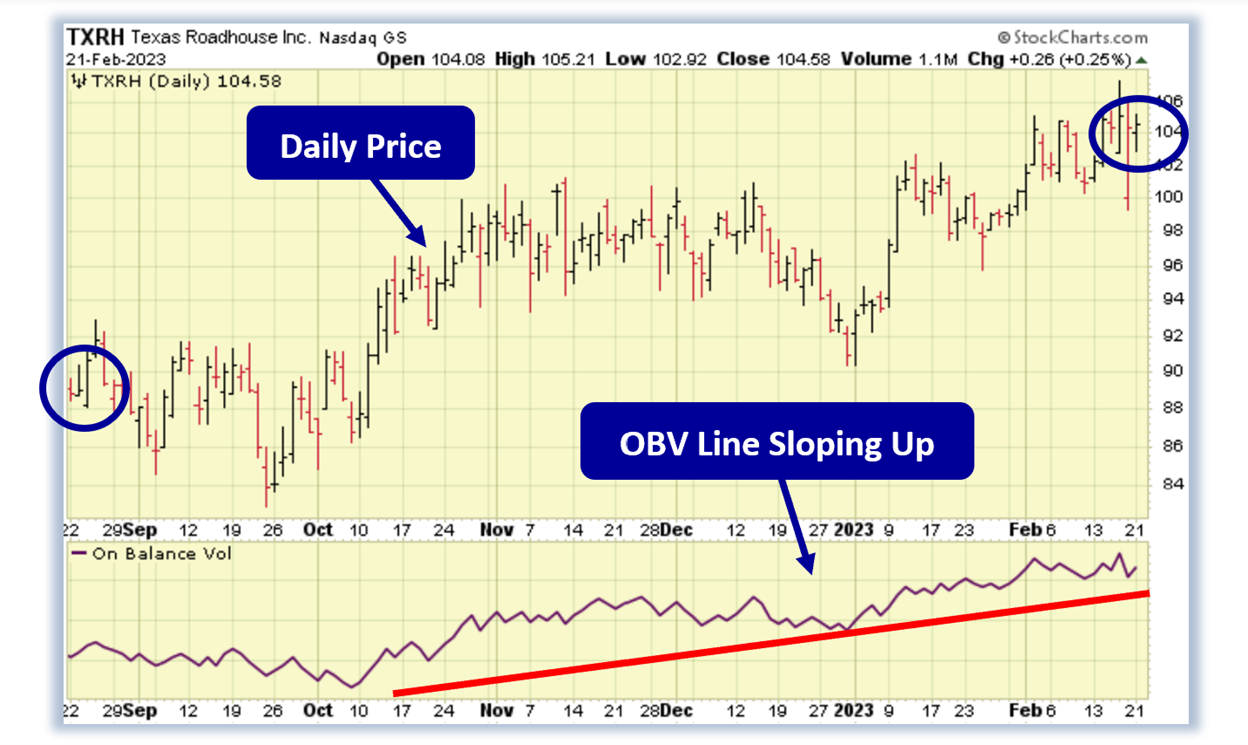
The TXRH daily price chart below shows that TXRH is in a price uptrend as the current price is above the price TXRH traded at six months ago (circled). The On Balance Volume chart is below the daily chart. On Balance Volume measures volume flow with a single Easy-to-Read Line. Volume flow precedes price movement and helps sustain the price downtrend. When a stock closes up, volume is added to the line. When a stock closes down, volume is subtracted from the line. A cumulative total of these additions and subtractions forms the OBV line.
On Balance Volume Indicator
- When close is up, volume is added.
- When close is down, volume is subtracted.
- A cumulative total of additions and subtractions form the OBV line.
Volume flow precedes price and is the key to measuring the validity and sustainability of a price trend.
We can see from the OBV chart below that the On Balance Volume line for TXRH is sloping up. An up-sloping line indicates that the volume is heavier on up days and buying pressure is exceeding selling pressure. Buying pressure must continue to exceed selling pressure to sustain a price uptrend. So, On Balance Volume is a simple indicator to use that confirms the price uptrend and its sustainability.
The numerical value of the On Balance Volume line is not important. We simply want to see an up-sloping line to confirm a price uptrend.
Confirmed ‘Buy’ Signal for TXRH
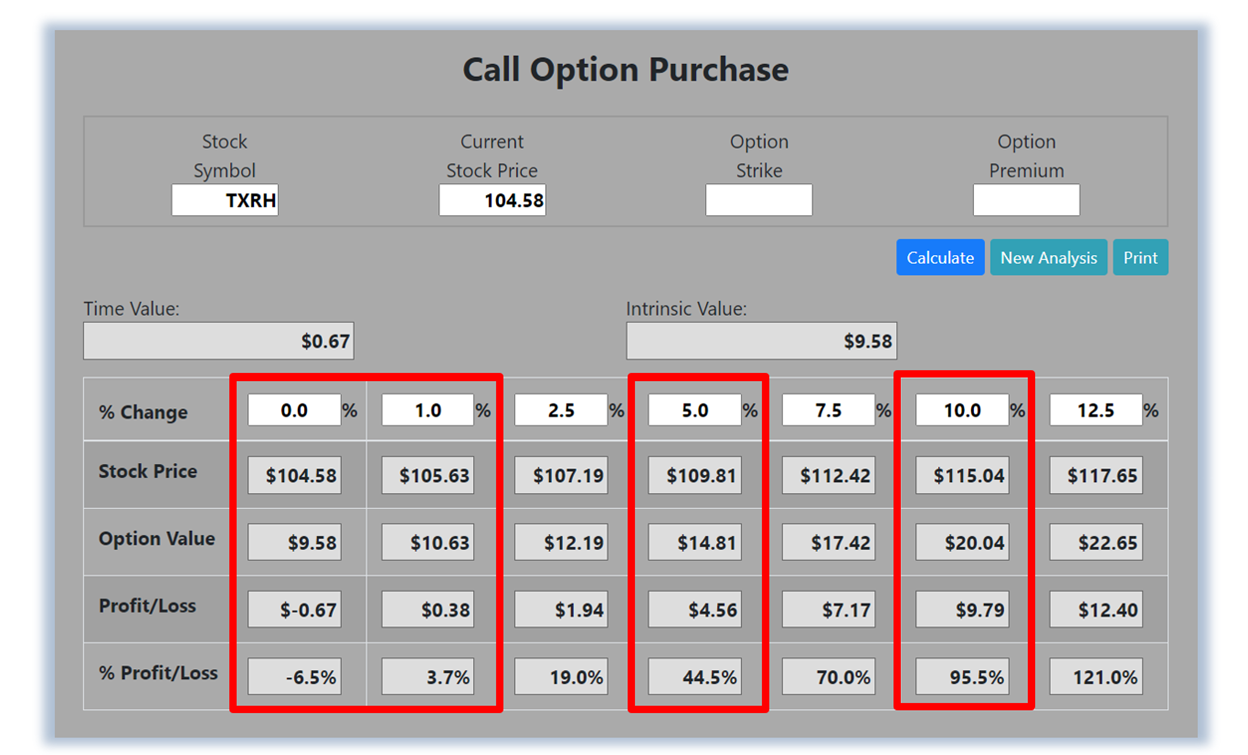
Since TXRH's OBV line is sloping up, the most likely future price movement for TXRH is up, making TXRH a good candidate for a stock purchase or a call option purchase. Let's use the Hughes Optioneering calculator to look at the potential returns for a TXRH call option purchase. The Call Option Calculator will calculate the profit/loss potential for a call option trade based on the underlying stock/ETF price change at option expiration in this example from a flat TXRH price to a 12.5% increase.
The Optioneering Team uses the 1% Rule to select an option strike price with a higher percentage of winning trades. In the following TXRH option example, we used the 1% Rule to select the TXRH option strike price but out of fairness to our paid option service subscribers, we don’t list the strike price used in the profit/loss calculation.
Trade with Higher Accuracy
When you use the 1% Rule to select a TXRH in-the-money option strike price, TXRH stock only has to increase by 1% for the option to break even and start profiting! Remember, if you purchase an at-the-money or out-of-the-money call option and the underlying stock closes flat at option expiration it will result in a 100% loss for your options trade! In this example, if TXRH stock is flat at 104.58 at option expiration, it will only result in a 6.5% loss for the TXRH option compared to a 100% loss for an at-the-money or out-of-the-money call option.
Using the 1% Rule to select an option strike price can result in a higher percentage of winning trades compared to at-the-money or out-of-the-money call options. This higher accuracy can give you the discipline needed to become a successful option trader and can help avoid 100% losses when trading options.
The goal of this example is to demonstrate the powerful profit potential available from trading options compared to stocks. The prices and returns represented below were calculated based on the current stock and option pricing for TXRH on 2/21/2023 before commissions. When you purchase a call option, there is no limit on the profit potential of the call if the underlying stock continues to move up in price.
For this specific call option, the calculator analysis below reveals if TXRH stock increases 5.0% at option expiration to 109.81 (circled), the call option would make 44.5% before the commission. If TXRH stock increases 10.0% at option expiration to 115.04 (circled), the call option would make 95.5% before the commission and outperform the stock return by nearly ten to one.
The leverage provided by call options allows you to maximize potential returns on bullish stocks. The Hughes Optioneering Team is here to help you identify profit opportunities just like this one.