
Two weeks ago the Consumer Price Index (CPI) and Producer Price Index (PPI) indicated that inflation picked up in January, after the CPI rose 0.5% and the PPI increased 0.7%, states Jim Welsh of MacroTides.com.
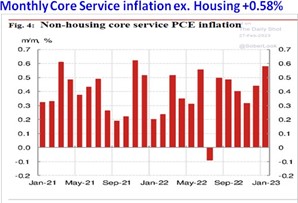
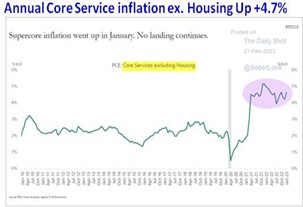
An inflation Triple Play was completed when the Personal Consumption Expenditures Index (PCE) jumped 0.6% in January. The annual PCE ticked up to 5.4% from 5.3% in December and the Core PCE was 4.7% versus 4.6%. Chair Powell has said the FOMC is focused on service inflation excluding housing as a key metric for determining when inflation has truly peaked and falling toward its 2.0% target. In January ‘Super’ inflation, as some have dubbed it, rose 0.58%. Worse, the annual rate isn’t falling as every other inflation metric has but is instead treading water.
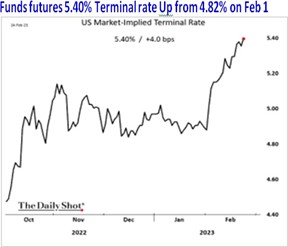
Financial markets have reacted negatively. The annual inflation rate for most indexes only rose by 0.1%, so it wasn’t that the increase in annual inflation was so bad. It was that annual inflation didn’t continue to fall as much as in prior months. Financial markets have believed that a continued decline in annual inflation would curb the FOMC’s appetite for additional rate hikes. The FOMC projected it would increase the Funds rate to 5.1% at the December 14 meeting, but the Fed Funds futures (Wall Street) only thought the FOMC would get to 4.82% before cutting the Funds rate by 0.50% before year-end. After better economic news (Jobs, ISM services, Retail Sales) and more inflation than expected, the Fed Fund futures now expect the FOMC to lift the Funds rate to 5.40% (Terminal Rate) in the first half of 2023.
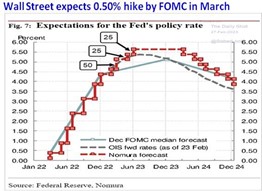
After being certain the FOMC would increase the Funds rate by 0.25% at the March 22 meeting, a vocal chorus now thinks the FOMC will raise it by 0.50%. FOMC members have said they want to avoid the policy mistake of the 1970s. Back then the FOMC increased the Funds rate too aggressively, causing recessions that forced the FOMC to slash rates before inflation was wrung out. This ‘Stop-Go’ policy failed to bring about a lasting decline in inflation. FOMC members now believe that by only increasing the Funds rate to a modestly restrictive level, a recession may be avoided, if GDP growth is held below its potential long enough to allow inflation to unwind more completely. The FOMC debated the proper restrictive level at the February first meeting and decided a 0.25% hike was better than a 0.50% increase. The same logic will likely win out at the March 22 meeting, with a concession given to those who want a 0.50% increase. The Median projection for the Funds rate will be increased from 5.10% to 5.375% (5.25%-5.50%), implying that the FOMC will raise the Funds rate by 0.25% at the May third meeting and on June 14.
The uptick in inflation in January is likely to be a Head Fake. As discussed in February Macro Tides and upcoming March Macro Tides, the takeaway values for the CPI from February through June 2022 total 4.66%. If the 2023 monthly increase for those months is 0.3%, the headline CPI could fall from 6.4% in January to 3.3% in June. Reverse Base Effects will also bring down the PPI and PCE in the next five months.
Financial markets have gone from disbelieving the FOMC to now expecting more hikes than what the FOMC may deliver. Financial markets may temporarily reverse their recent trends (stocks down, Treasury bonds down, Gold down, Dollar up), when inflation data resumes its downtrend (February CPI March 14), and job growth plunges from 517,000 (March tenth). Markets will quickly expect a 0.25% increase at the March 22 meeting and not the dreaded 0.50%. Wall Street wants to believe that inflation is the key and will be seduced (again) into thinking stocks can rally as long as inflation is falling. Chair Powell has made it clear that the labor market is the key to monetary policy in 2023. Wall Street hasn’t listened and wants to believe the economy will have ‘No Landing’ in 2023. The March Macro Tides discusses why the shift from a ‘Hard Landing’ last summer to “No Landing” now only sets the stock market up for another downdraft as Wall Street is ‘surprised’ by the coming economic slowdown.
Treasury Yields
The two-year Treasury yield jumped from 4.036% on February first (Powell’s press conference), after Wall Street reassessed the outlook for the Funds rate. On February 24, the two-year yield pushed up to 4.84% the highest since it reached 4.88% on November third. In contrast, on February 23 the ten-year Treasury yield climbed 3.978% and above its December 30 high of 3.905%, but below the high of 4.333%, it reached on October 21. On November seventh the ten-year recorded a lower high of 4.218%. The 30-year has so far held below its December 30 high of 3.990% after reaching 3.981% on February 23, and way under its October 27 high of 4.4425%.
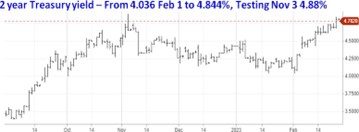
The path of the two-year Treasury yield likely points the way for the ten-year and 30-year. If the two-year close convincingly above 4.88%, the 30-year will confirm the breakout in the ten-year, which is already comfortably above its December 30 high. The 30-year has yet to move above its December 30 high, but it won’t take much of an increase to confirm. So there is an inter-market divergence between the ten-year and 30-year, but it’s tenuous.
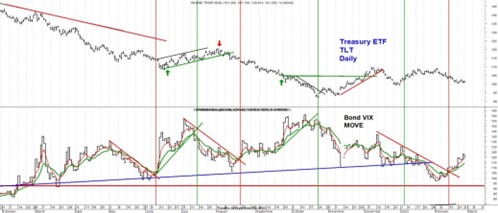
The equivalent of the Cboe SPX Volatility Index (VIX) for the S&P 500 (SPX) is the MOVE Index for Treasury bonds. iShares 20+ Year Treasury Bond ETF (TLT), which trades in the direction of bond prices. The MOVE Index works the same way as the VIX does for the S&P 500. The VIX increases as the S&P 500 declines and falls when the S&P 500 rallies. The red vertical lines denote when the MOVE index reversed higher, which coincided with TLT declining. TLT has rallied after the MOVE Index established a new downtrend as noted by the green vertical lines. The MOVE Index is trending higher, so the risk in the near term is that Treasury yields along the entire curve continue to move higher.
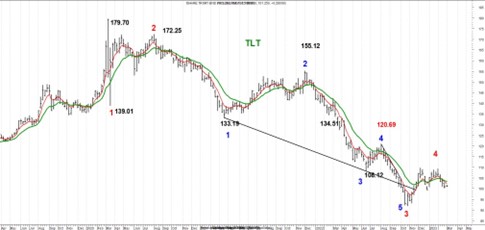
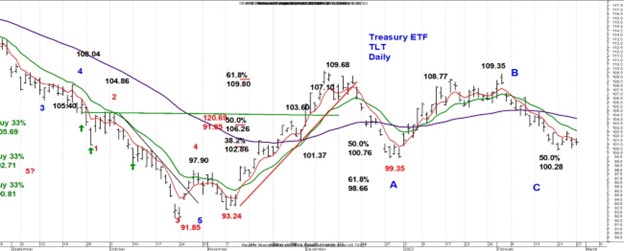
The Treasury bond market is at a crossroads. As I discussed weeks ago, the rally since bond prices reached a bottom in October is likely Wave four from the high in March 2020. The crossroad is whether Wave four is complete or whether the recent high is Wave a of Wave four. My bias has been that the rally was Wave a, and the current pullback was Wave b. If correct, Wave c would take TLT up above
$109.68, and Treasury bond yields below the lows on February second. (3.334%, ten-year, 3.4987%, 30-year) If TLT undercuts the December 28 low of 99.35, it will need to reverse higher quickly to reaffirm that Wave b is ending. If not, Treasury yields will be headed up to the October highs (Wave five).
Stocks
In the February 20 WTR, I noted that an inter-market divergence had developed on February 17 as the S&P 500, DJ Industrials, and NYSE Composite fell below their February tenth lows, but the Russell 2000, DJ Transports, and Value Line Composite held above their February tenth lows. “These inter-market divergences suggest the stock market reached a short-term low on February 17. It also underscores the importance of the Russell 2000, DJ Transports, and Value line Composite remaining above their February 10 lows, and ideally above the lows on February 17 in coming days.” Within the first two hours of trading on February 21, the Russell 2000, DJ Transports, and Value Line Composite dropped below their February tenth lows negating their inter-market divergence. The advantage of using Technical Analysis compared to Fundamental Analysis is Technical Analysis can provide a precise point of knowing when the analysis is wrong, as opposed to waiting another 30 days for an economic report.
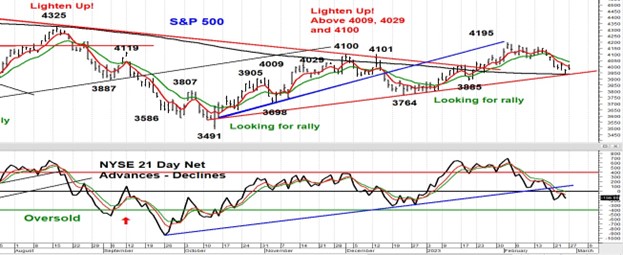
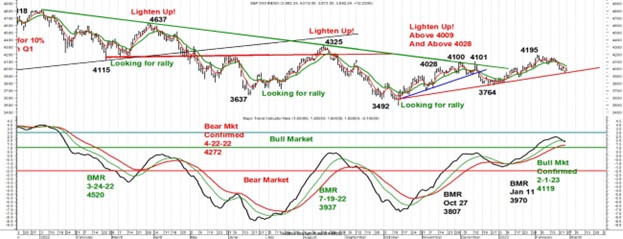
The S&P 500 rallied from the October low of 3491 to 4195 (704 points). The 50% retracement of the rally is 3845 and the 61.8% retracement is 3760. The S&P 500 is trying to hold the red trend line connecting the October low and the late December low. The 21-day Oscillator of Advances minus Declines has broken its uptrend from its low last September but is still not yet oversold. If Wall Street is overpricing the March 22 rate hike (0.50% vs. 0.25%), the S&P 500 still has the potential of trading above 4195, if economic data indicates the increase will only be 0.25%. For this to remain a possibility, the S&P 500 needs to hold above 3760. Ideally, the S&P 500 will drop to 3815-3845 and the 21-day Oscillator will become oversold after falling below the green horizontal line. A drop below the rising red trend line for the S&P 500 will create more bearishness, which would set the market up for a better rally.
Irrespective of the near-term choppiness in the next two months, the outlook remains for the economy to show more slowing by mid-year, with the odds of a recession beginning before year-end. Once this becomes clear to those who think there will be No Landing, the S&P 500 is expected to retest the October low of 3491, and potentially fall to 3200.
Gold
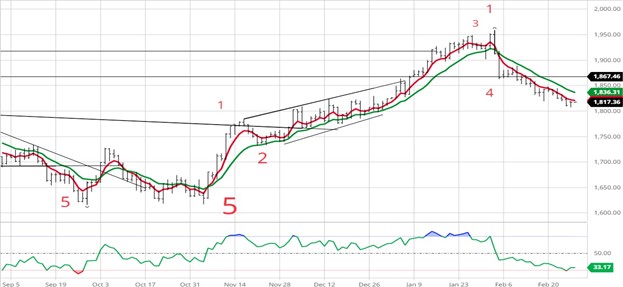
Likely, the correction from $1959 is not complete, and Gold can drop to $1780. The 50% retracement of the rally from $1616 to $1959 is $1787. If Gold trades down to 1780 -1790, a rebound to $1870 - $1890 should follow. The odds of a rally above $1959 have diminished. If Gold rallies to $1870 - $1890, a decline to $1720 - $1750 are expected to follow.
Gold Stocks
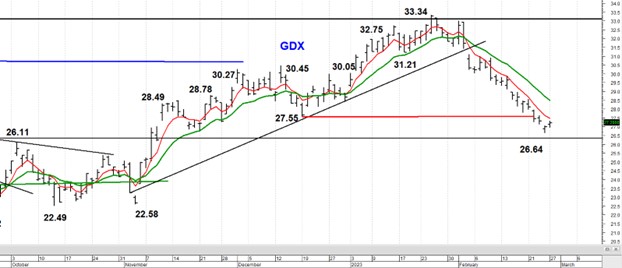
GDX has been expected to decline below 27.55 for weeks and last week it fell to 26.64. I’m not convinced the decline is over, especially if Gold drops below $1800 and the S&P 500 falls more. The expected rally to 30.00 – 31.00 may have to wait until GDX trades down to 26.11 or so. The 61.8% retracement of the rally from 21.52 to 33.34 is 26.04.
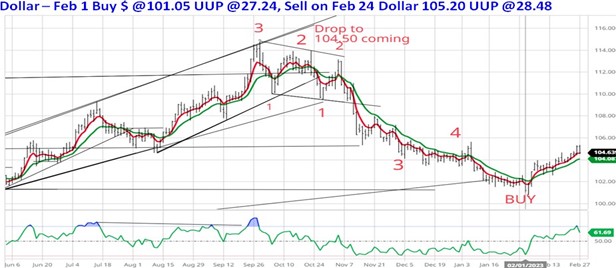
Dollar
I recommended the Dollar and the Dollar ETF (UUP) on February first at 101.04 and UUP at 27.24. I recommended selling the position on the opening on February 24, after the Dollar popped in response to the PCE inflation news. The Dollar was trading above 105.20 and UUP traded at $28.48 and $28.50 in the first 15 minutes after the opening. The Dollar provided Technical clues that it was bottoming on February first, even as Wall Street interpreted Powell’s comments as dovish. The Dollar then rallied after the Fundamental news changed Wall Street’s expectations for the FOMC and Funds rate. The Dollar may still rally above 106.00, but a quick profit of 4.50% and the opportunity to sell into the PCE news simply made sense.
The Dollar will likely pull back if a 0.25% becomes Wall Street’s expectation.
Tactical Investment Advice in 2023
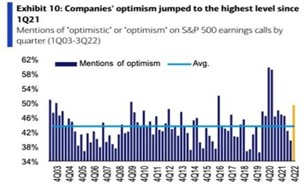
In the January 17 WTR, I noted that the economy was still OK in the fourth quarter, which suggested Q4 earnings would be decent and help the S&P 500 rally above 4101 and potentially to 4250. On February 23 the Bureau of Economic Analysis reported that GDP grew by 2.7% in the fourth quarter. Overall, earnings have been OK with most firms beating or matching lowered expectations. The percentage of companies expressing optimism on fourth-quarter conference calls to discuss the outlook for earnings in 2023 reached its highest level since the first quarter of 2021. The shift in optimism is an amazing turnaround from the third quarter. The level of optimism on the fourth quarter calls was well above the average since 2003 and only a handful of quarterly conference calls since 2003 showed more optimism. CEOs who think the economy will be doing better in the coming months are unlikely to cut capital investment and some portion will increase capital spending. At a minimum, the economy will get a lift from fewer companies that don’t cut spending and a boost from those that increase it. CEOs with a more optimistic view of the economy are unlikely to preemptively lay off workers in anticipation of a slowdown, offering little relief for the already tight labor market tight.
In the February sixth WTR, I thought the following two weeks would be quite choppy as the tug of war between better economic data wrestled with the realization that the FOMC will be increasing the Funds rate to 5.0% or higher. In the February 20 WTR the expectation of a rally above 4195 based on positive inter-market divergences on February 17, was negated on February 21 when all the major averages fell below their February ten lows. As long as the S&P 500 holds above 3760, there is still a chance the S&P 500 will rally above 4195 before a retest of the October low of 3491 is retested or broken.
Outlook
The Major Trend Indicator (MTI) generated a Bear Market Rally Buy (BMR) signal on January 11, when the S&P 500 closed at 3970. On February first the MTI climbed above the green horizontal line which confirms a bull market began at 4119. Fundamentally, I’m skeptical of this signal, since the S&P 500 has rallied on the expectation that earnings will grow in 2023 and that no recession is on the horizon. The MTI closed below the green moving average on February 22, which represents a short-term sell signal.
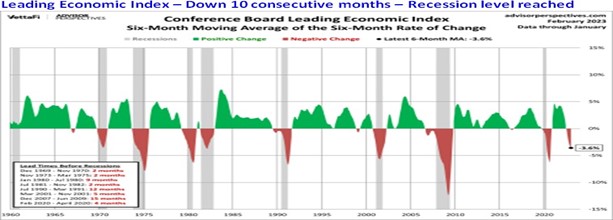
The three most reliable recession indicators (Yield Curve inversion, Leading Economic Index, and Lending standards) have each reached a level that has developed before every recession in the last 60 years. I’m relying on those indicators. At a minimum, the economy is likely to experience a sharp slowdown that increases the concern that a recession is indeed occurring. There is likely to be at least one quarter with a decline in GDP. That should create a correction that provides a better entry point below 4119, even if a retest of the October low is avoided. That said a
recession before the end of 2023 is still the most likely outcome. A recession would lead Wall Street to cut earnings estimates for the second half of 2023 and 2024 and create the potential for a retest of the October low at 3491 or a decline to 3200. The 61.8% retracement of the rally in the March 2020 low of 2190 and high of 4818 in January 2022 is 3195.
Recession Watch
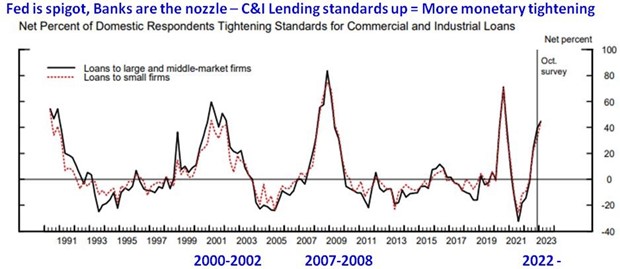
The 2.9% increase in GDP in Q4 has convinced Wall Street that a recession can be avoided. The message from three indicators that have each reached a level that has always been followed by a recession suggests a recession is likely after mid-2023. The magnitude of the current yield curve inversion increases the validity of the yield curve recession message. The Leading Economic Index (LEI) has declined for ten consecutive months, and the depth of the decline has always been followed by a recession since 1960. Lending Standards for the fourth quarter were released on February sixth and were tightened further, with more than 43% of banks increasing lending standards. In the last 30 years, a recession has developed whenever the percentage of banks tightening lending standards has exceeded 20%. A decline in the availability of credit is more restrictive and problematic for the economy than increasing the cost of credit. The combination of these three reliable recession signals suggests avoiding a recession is unlikely.
Several charts in this letter were from The Daily Shot.
Learn more about Jim Welsh at MacroTides.com.