

The selling pressure subsided last week, and nine of eleven S&P SPDR sectors were positive, notes Bonnie Gortler of bonniegortler.com.
Materials (XLB) and Industrials (XLI) were the leading sectors, and Consumer Staples (XLP) and Utilities (XLU) were the weakest, with the SPDR S&P 500 ETF Trust (SPY) +1.97%.
S&P SPDR Sector ETFs Performance Summary 2/24/23 – 3/03/23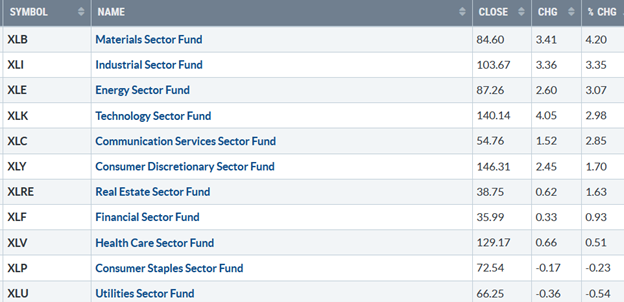
Source: Stockcharts.com
Figure 2: Bonnie's ETFs Watch List Performance 2/24/23 – 3/03/23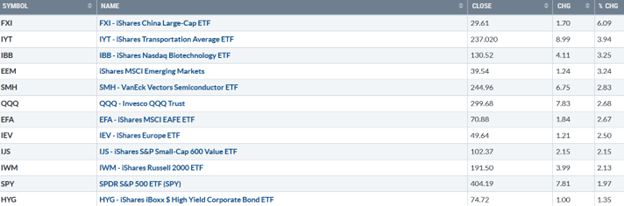
Source: Stockcharts.com
The international markets reversed to the upside after several weeks of decline, led by China and Emerging Markets. Transports and Biotechnology were stronger than the S&P 500 (SPY), as investors were willing to be more aggressive after being cautious in February.
Figure 3: CBOE Volatility Index VIX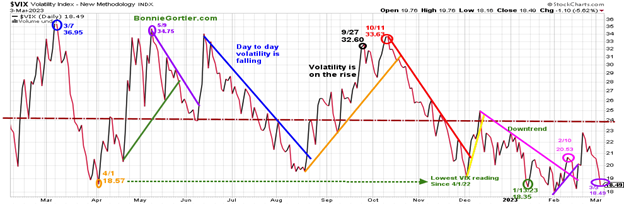
Source: Stockcharts.com
The CBOE Volatility Index (VIX), a measure of fear, traded above 20.00 for most of 2022, with a high at 36.95 on 3/7 (blue circle) and a low on 4/1/22 at 18.57. A new VIX low didn’t occur until 1/13/23 at 18.35 (green circle) after VIX quieted in early December 2022.
Last week, all the averages were higher, with VIX falling sharply to close at 18.49(purple circle), its lowest level since 2/14. If VIX continues falling, the odds favor a breakout from the current trading range in the major averages. On the other hand, a close above 24.00, then watch for a potentially significant decline.
Figure 4: UST 10YR Bond Yields Daily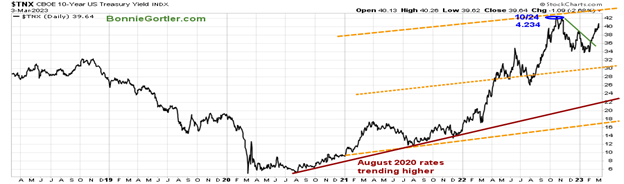
Source: Stockcharts.com
The 10-Year U.S. Treasury yields rose last week, closing Friday at 3.964%, but pulled back from its high of 4.091% made on 3/2. Support is 3.00%, and resistance is 4.25 and 4.40%. The major averages for the week were all higher. The Dow gained +1.75%. The S&P 500 was up +1.90 %, its first gains in the last four weeks, while the Nasdaq rose 2.58%. The Russell 2000 Index advanced +2.00%.
Figure 5: Value Line Arithmetic Average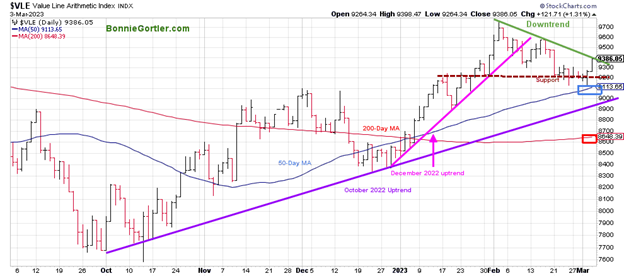
Source: Stockcharts.com
The Value Line Arithmetic Index ($VLE) (a mix of approximately 1700 stocks) rose +2.01%, close to breaking the downtrend after holding above key support at 9200 and above the 50 and 200-Day Moving Average, a sign of underlying strength. Key support lies at 9000, and resistance is at 9500 and 9600. Continued strength would be bullish in the short term.
Weekly market breadth improved last week on the New York Stock Exchange Index (NYSE) and for Nasdaq. The NYSE had 2082 advances and 1167 declines, with 245 new highs and 93 new lows. There were 3118 advances and 1948 declines on the Nasdaq, with 325 new highs and 340 new lows. On a side note, the volume patterns I track have improved significantly, turning up from an oversold condition in an area where short-term rallies begin.
Improvement in market breadth
Figure 6: Nasdaq Advance Decline Line Daily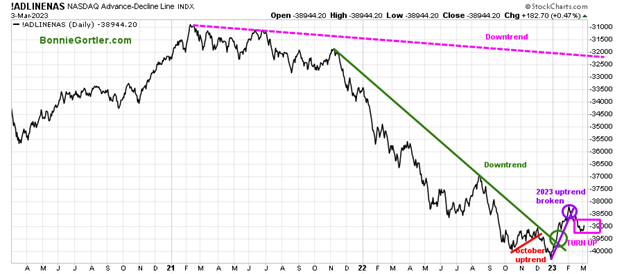
Source: Stockcharts.com
The Nasdaq daily advance-decline line is a technical indicator that plots the difference between the number of advancing and declining stocks daily. In January, the October 2022 downtrend was broken (green line). In February 2023, the short-term uptrend gave way and is in the process of testing the low. The AD-Line turned up. A break above the February highs would be positive, implying a successful test of the low. Watch the market breadth for successive days if there are more advances than declines this week or more declines than advances to give a clue for the short-term direction of the Nasdaq. With the strong close on Friday, a continued rally is likely.
Figure 7: Daily New York Stock Exchange (NYSE) New Lows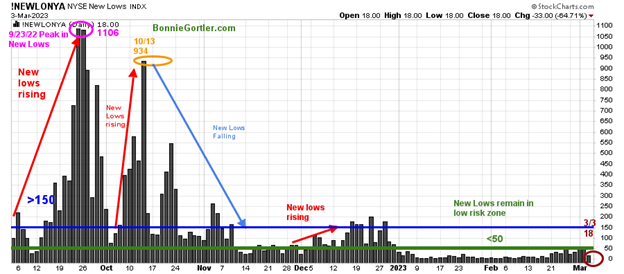
Source: Stockcharts.com
Watching New Lows on the New York Stock Exchange is a simple technical tool that helps awareness of the immediate trend's direction. New lows warned of a potential sharp pullback, high volatility, and "panic selling" for most of 2022, closing above 150. The peak reading was 9/23/22 when New Lows made a new high of 1106 (pink circle). New Lows contracted to their lowest level on Friday after they had started to increase, falling last week from 47 on 2/24, closing at 18 on 3/3 (brown circle), in the lowest risk zone below 25, and short-term positive for the market.
On the other hand, a rise above 150 and an expansion of New Lows would be a warning of weakness forthcoming. Learn more about the significance of New Lows in my book, Journey to Wealth, published on Amazon. Learn about coaching with Bonnie. Ask questions. Discover more about the coaching processes in this 15-minute call by emailing me at Bonnie@BonnieGortler.com. I would love to schedule a call and connect with you.
Figure 8: Daily New York Stock Exchange (NYSE) Cumulative Advance-Decline Line (Top) and NYSE (Bottom) 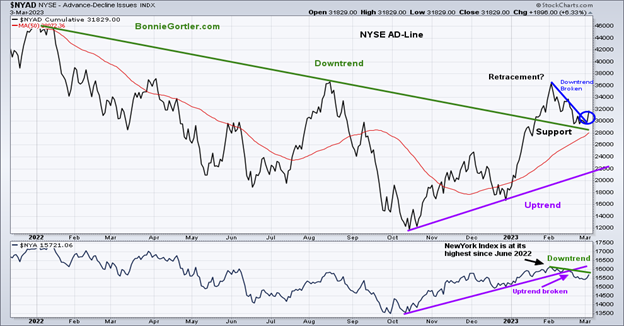
Source: Stockcharts.com
Last week the AD-Line retraced to where it broke out from and turned up holding support and then breaking the downtrend (blue circle), which is bullish. The NYSE (bottom chart) turned up last week after breaking the October uptrend (purple line) and is now close to breaking the February downtrend, which would be positive.
Continued strength in AD-Line and the New York Index breaking the downtrend (green line lower chart) would imply higher prices in the short term. On the other hand, weakness in the AD-Line (top chart) below support and the NYSE turning down would warn of lower prices in the short term.
Figure 9: Daily iShares Russell 2000 (IWM) Price (Top) and 12-26-9 MACD (Middle) and Money Flow (Bottom)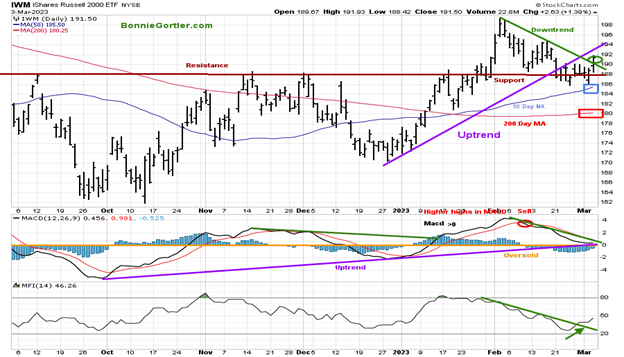
Source: Stockcharts.com
The top chart is the daily iShares Russell 2000 Index ETF (IWM), the benchmark for small-cap stocks, with a 50-Day Moving Average (MA) (blue line) and 200-Day Moving Average (MA) (red line) that traders watch and use to define trends. IWM closed higher at 191.50, up 2.00%, breaking the downtrend (green line) and above its rising 50-Day MA (blue rectangle) and 200-Day MA (red rectangle), a sign of underlying strength.
MACD remains on a sell, slightly over zero, rising in an uptrend from October (purple line). It would be positive if IWM rises early in the week, breaking the February downtrend. The Money Flow Index (MFI) in the lower chart is favorable, with MFI breaking its downtrend and rising, implying money is flowing into small caps. Support is 188.00, 184.00, and 180.00, with resistance at 194.00 and 199.00. With the intermediate trend favorable (chart not shown), daily MACD working off its overbought condition, and Money Flow positive, the odds favor IWM challenging the February highs.
Figure 10: Daily Invesco QQQ Trust (QQQ) Price (Top) and 12-26-9 MACD (Bottom) 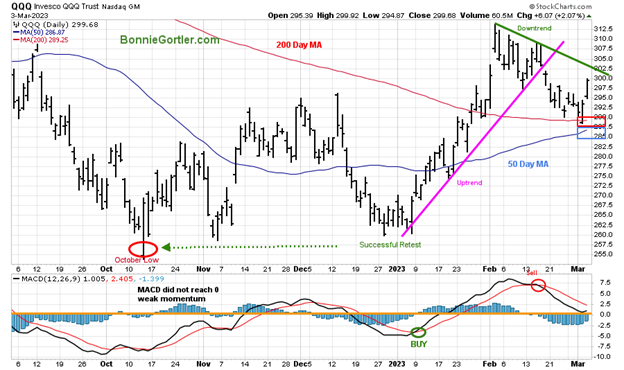
Source: Stockcharts.com
The chart shows the daily Invesco QQQ (QQQ), an exchange-traded fund based on the Nasdaq 100 Index. QQQ made a low in October 2022 (red circle), followed by a successful retest of the low in early January 2023, then broke the uptrend (pink line) after reaching a new six-month high in February. QQQ rose +2.68% last week, closing near its high on Friday at 299.68, above the 50-Day Moving Average and the 200-Day Moving Average (red rectangle).
The bottom chart is MACD (12, 26, 9), remaining on a sell, no longer falling, and has worked off its overbought condition. Support is 287, and resistance is 303.00, 310.00, and 314.00. With the intermediate trend favorable and Money Flow rising (chart not shown), the odds favor Friday's rally to continue and break the February downtrend early next week unless QQQ closes below 287.00 support.
SMH remains stronger than QQQ based on relative strength for the intermediate trend.
Figure 11: Semiconductors (SMH)/Invesco QQQ Trust/ Ratio (SMH/QQQ) Weekly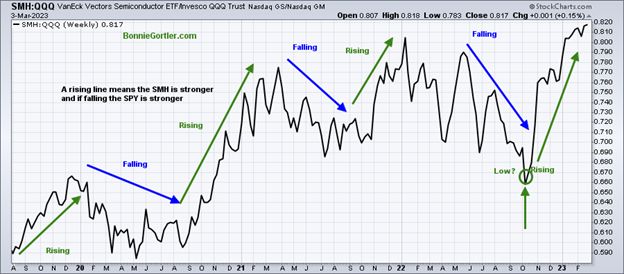
Source: Stockcharts.com
The top part of the chart is the weekly Semiconductors (SMH) Invesco QQQ Trust Relative Strength Index Ratio (SMH/QQQ). A rising line means the SMH is stronger; if falling, the QQQ is stronger. It’s encouraging SMH made a new relative strength high last week. The SMH will often be a clue before a correction starts because it will lag and fall faster than the QQQ leading the broad market lower. Keep an eye out next week if SMH continues to outperform the QQQ, which is positive, or on the other hand, if SMH underperforms the QQQ, which would be considered short-term negative.
Figure 12: The S&P 500 Index (SPY) Daily (Top) and 12-26-9 MACD (Bottom)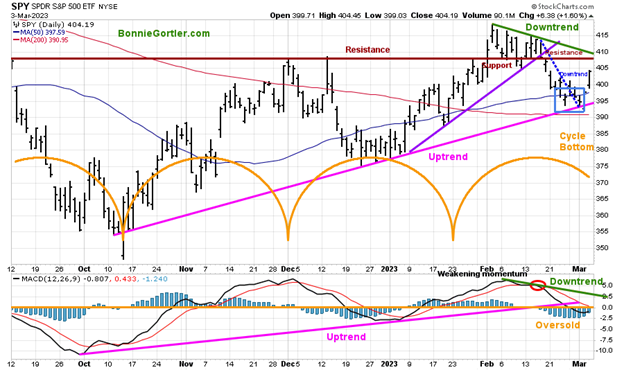
Source: Stockcharts.com
The S&P 500 (SPY) made a six-month high in early February 2023 and turned down. The uptrend from October 2022 remains intact. SPY reversed higher after falling below the 50-Day Moving Average (blue rectangle), tripping the stops intra-week to close up +1.97%, closing near its high on Friday. The short-term cycle bottomed, as mentioned in the Market Update on 2/24/23.
MACD (lower chart) is on a sell and broke the uptrend from October.
However, MACD is now below zero and positioned for a new buy signal this week. I would like to see momentum rise quickly and break the downtrend from February (green line). Support is 400.00, 395.00, and 390.00, while resistance is 408.00 and 415.00. With the SPY closing above 404.00, money flow turning up (chart not shown), and the short-term cycle bottoming, the next leg higher is likely to have started. A close below 290.00 would negate my bullish outlook.
Keep an eye on the tape action of Financials
Figure 13: The Financial Select Sector SPDR (XLF) Daily (Top) and 12-26-9 MACD (Bottom)
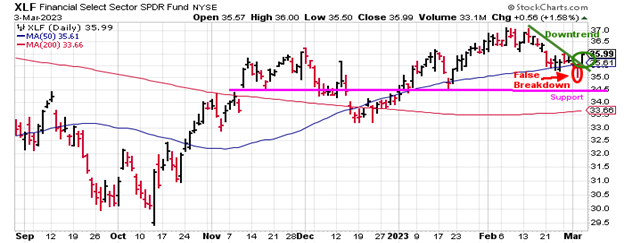
Source: Stockcharts.com
Financials (XLF) fell early in the week but finished up 0.93% for the week closing near their highs on Friday. A potential false breakdown turned into an upside reversal that broke the February downtrend on Friday, 3/03. Continued strength through 37.00 would imply a potential rise to 40.00, a close below 34.56 would negate my bullish outlook.
Summing Up:
Investors shrugged off higher rates, analysts lower stock price forecasts and negativity outlooks, and went bargain-hunting after a seasonally weak February. The market breadth and short-term momentum indicators improved with key support levels intact. It’s bullish the major averages closed at their highs of the week, the global market joined the advance, and short-term downtrends broke. Higher prices in the short term are likely.
Remember to manage your risk, and your wealth will grow.
Let’s talk investing. You can set up your Free 30-minute Wealth and Well-Being Strategy session by clicking here or emailing me at Bonnie@BonnieGortler.com. I would love to schedule a call and connect with you.
Disclaimer: Although the information is made with a sincere effort for accuracy, it is not guaranteed that the information provided is a statement of fact. Nor can we guarantee the results of following any of the recommendations made herein. Readers are encouraged to meet with their advisors to consider the suitability of investments for their particular situations and determination of their own individual risk levels. Past performance does not guarantee any future results.


