

They say patience is a virtue. Slowing down and formulating a plan is useful in many aspects of life, especially the stock market, states Lucas Downey of Mapsignals.com.
Patient investors could be rewarded soon as markets are quickly nearing a major buy signal. Consider this: Studies have shown that there’s power in waiting. Facing unsettling circumstances is part of life. But if we reframe our situation, we can turn challenges into opportunities. Sit tight and wait for the storm to pass.
Stocks have been under serious pressure since February. Yesterday’s Fed meeting further strengthened that trend. Additional increases in interest rates are pressuring the economy...and equities. However, we’re closing in on an extremely rare buy signal. History shows it’s worth waiting for. We’ll get to that in a bit. Now, let’s take an unemotional journey through Big Money data.
Nearing a Major Buy Signal
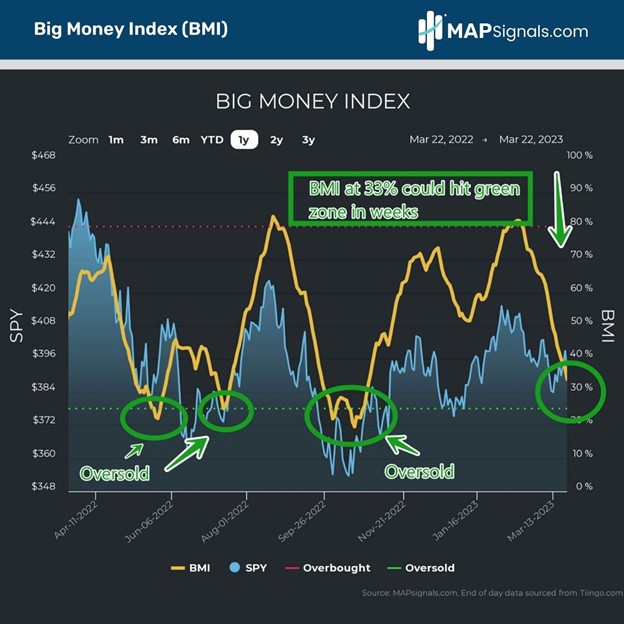
Sellers remain in control. There’s no better way to see that than with the Big Money Index (BMI). It’s fallen like a rock for weeks. When buyers are few, the trend favors lower levels. Notice how markets ebb and flow with the BMI’s every move. At 33%, it’s just eight points above the green area of 25%.
Our data is in a very distressed state:
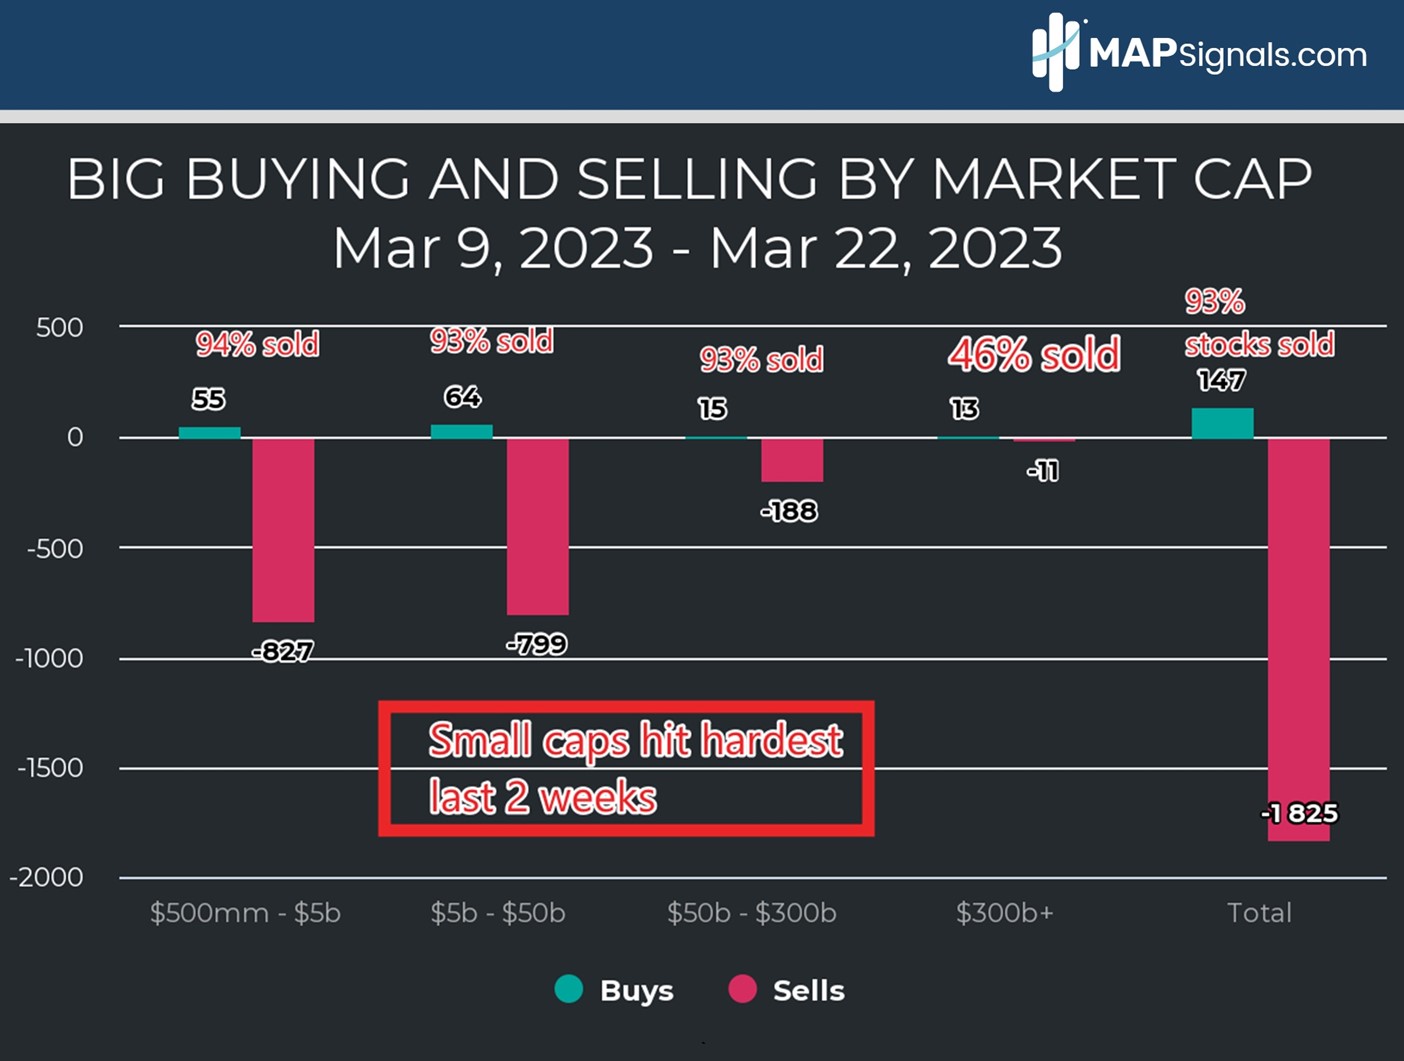
A fall of this magnitude indicates a heavy supply in stocks. Below are plots of the last two weeks of buys and sells by market cap. Get this, 93% of our signals were sold from March ninth to March 22. Small- and mid-cap stocks have been torpedoed, while mega-cap stocks ($300B+) have been better to buy:
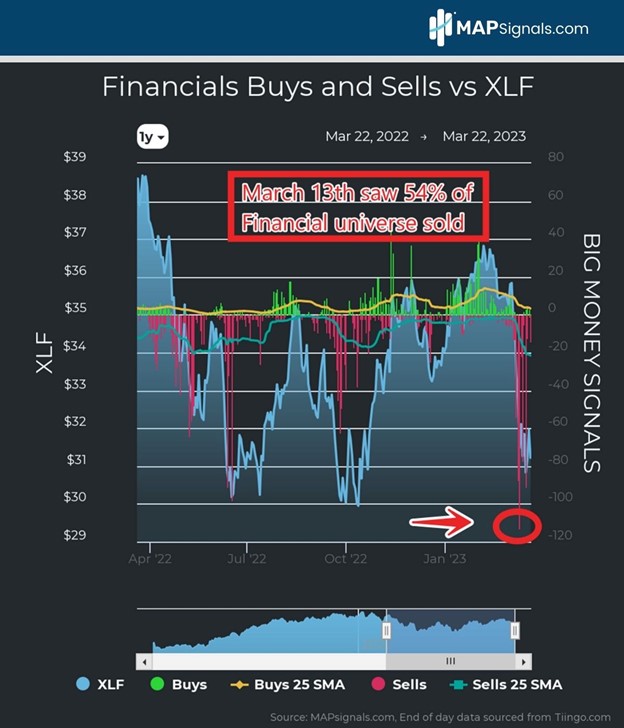
Drilling down further, two areas are feeling the brunt of the pullback: Financials and Real Estate. Let’s view Financials first. Recent bank runs have sent smaller regionals down hard. On March 13, 54% of our Financial universe was sold—that’s a major reason for the decline in the BMI:
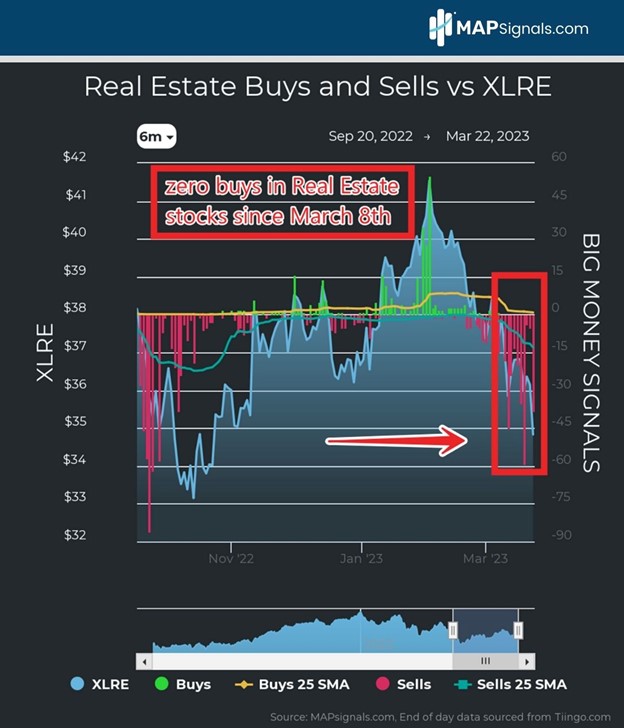
Higher rates have also weighed heavily on Real Estate stocks. Incredibly since March eighth, zero stocks were bought in the sector, while 263 equities were sold:
These sectors partly explain the downtrend in our Big Money Index. But now it’s time to shift from negative to positive! When market meltdowns reach a tipping point, it means we’re nearing a major buy signal. Going back to 1990 (including back-tested data) when we hit oversold the forward returns for the market are stunningly positive.
We’ve had only 24 oversold instances in just over 30 years, indicating just how rare this signal is. From the first day we reach a reading of <25% in the BMI, the average gain for the S&P 500 a month later is +3.6%. A year later gains an average of +15.3%. Two years later it’s nearly a 30% jump!
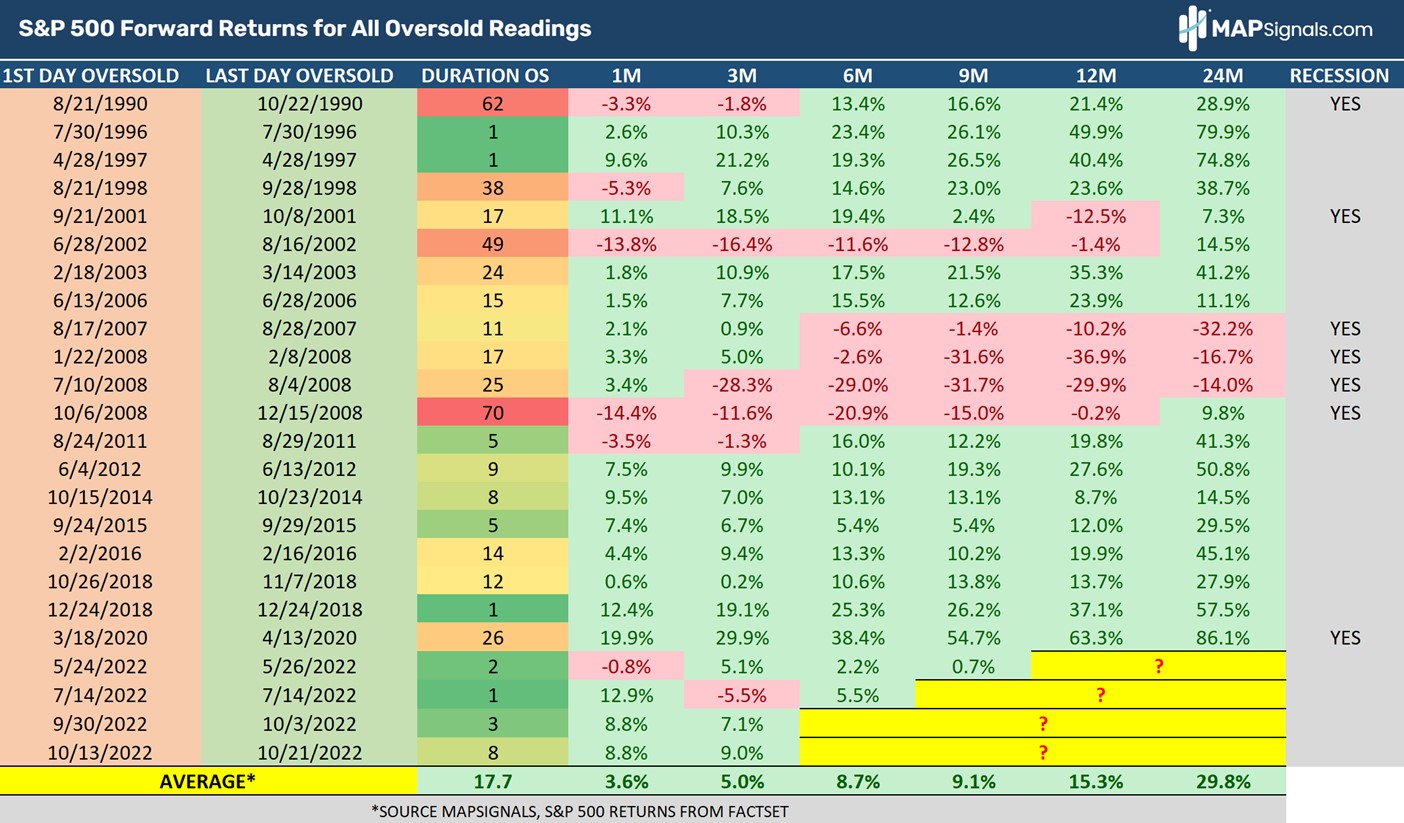
Does it pay to be patient? It does. Based on history, breaching the green zone means expecting a monster rally in stocks weeks and months later. That’s worth waiting for and why I’m happy relying on data for answers rather than headlines.
Let’s wrap up.
Here’s the Bottom Line: Selloffs are painful in the short run. We’re in the midst of a major pullback, that appears to be nearing a major buy signal.
An oversold Big Money Index has rewarded patient investors with a great entry point in the past. Chances are in the coming weeks, that signal will offer another green light for those in waiting...like me. These selloffs often preface breakneck rallies. It’s important to plan now!
Studies suggest people can benefit from reframing negative circumstances. There is power in patience. The same goes for investing. Wait for the signal. And use a map!
To learn more about Lucas Downey, visit Mapsignals.com.


